Moisture Updates - March 15, 2023
We have compiled some handy maps, courtesy of Alberta Natural Resources Management, on current monthly precipitation, as well as estimates and averages for spring.
At the end of this article we have included some historic data on monthly averages for Alberta. If you would like more information on climate normals these can be found here - Climate Normals for Alberta. Among other things it shows the distribution of precipitation on a much finer timescale. For example you can see the average timing of moisture throughout the year for the 1991-2020 period for a single location, and even compare it to other historical periods (eg. 1961-1990), and other locations, all at once.
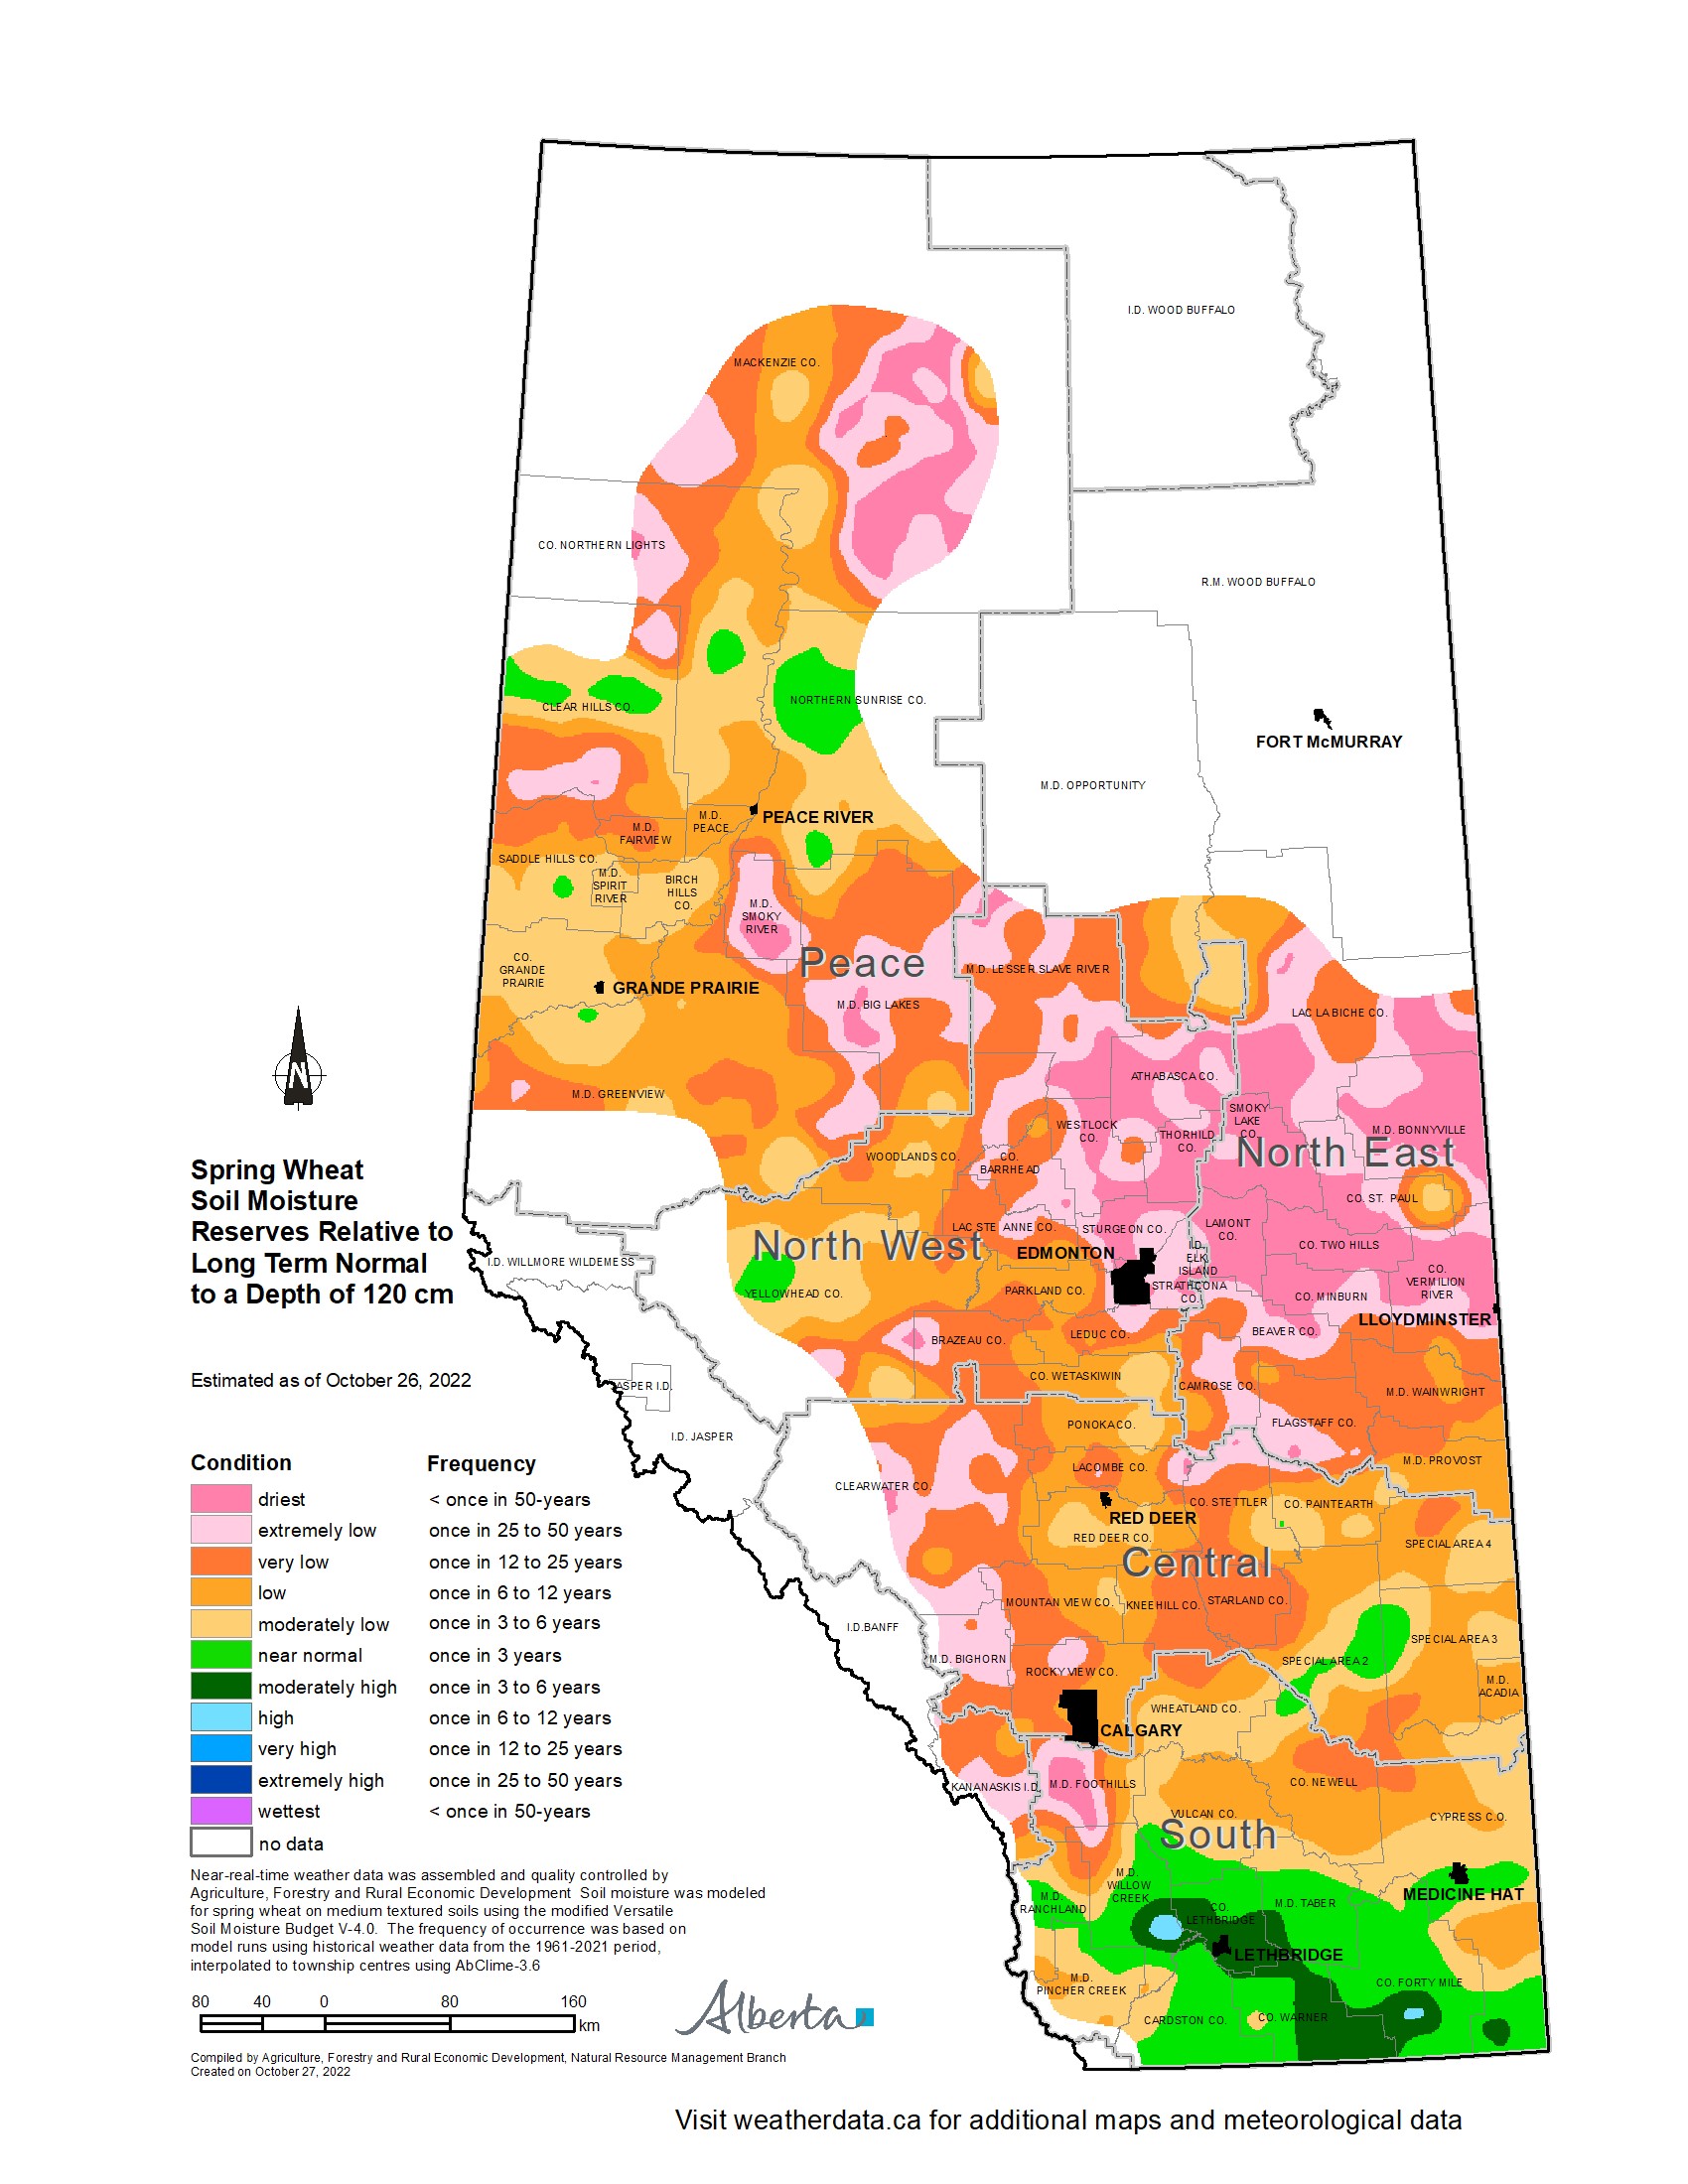
Map 1: Spring Wheat Soil Moisture Reserves Relative to Long Term Normal to a Depth of 120cm
(estimated as of Oct. 26, 2022)
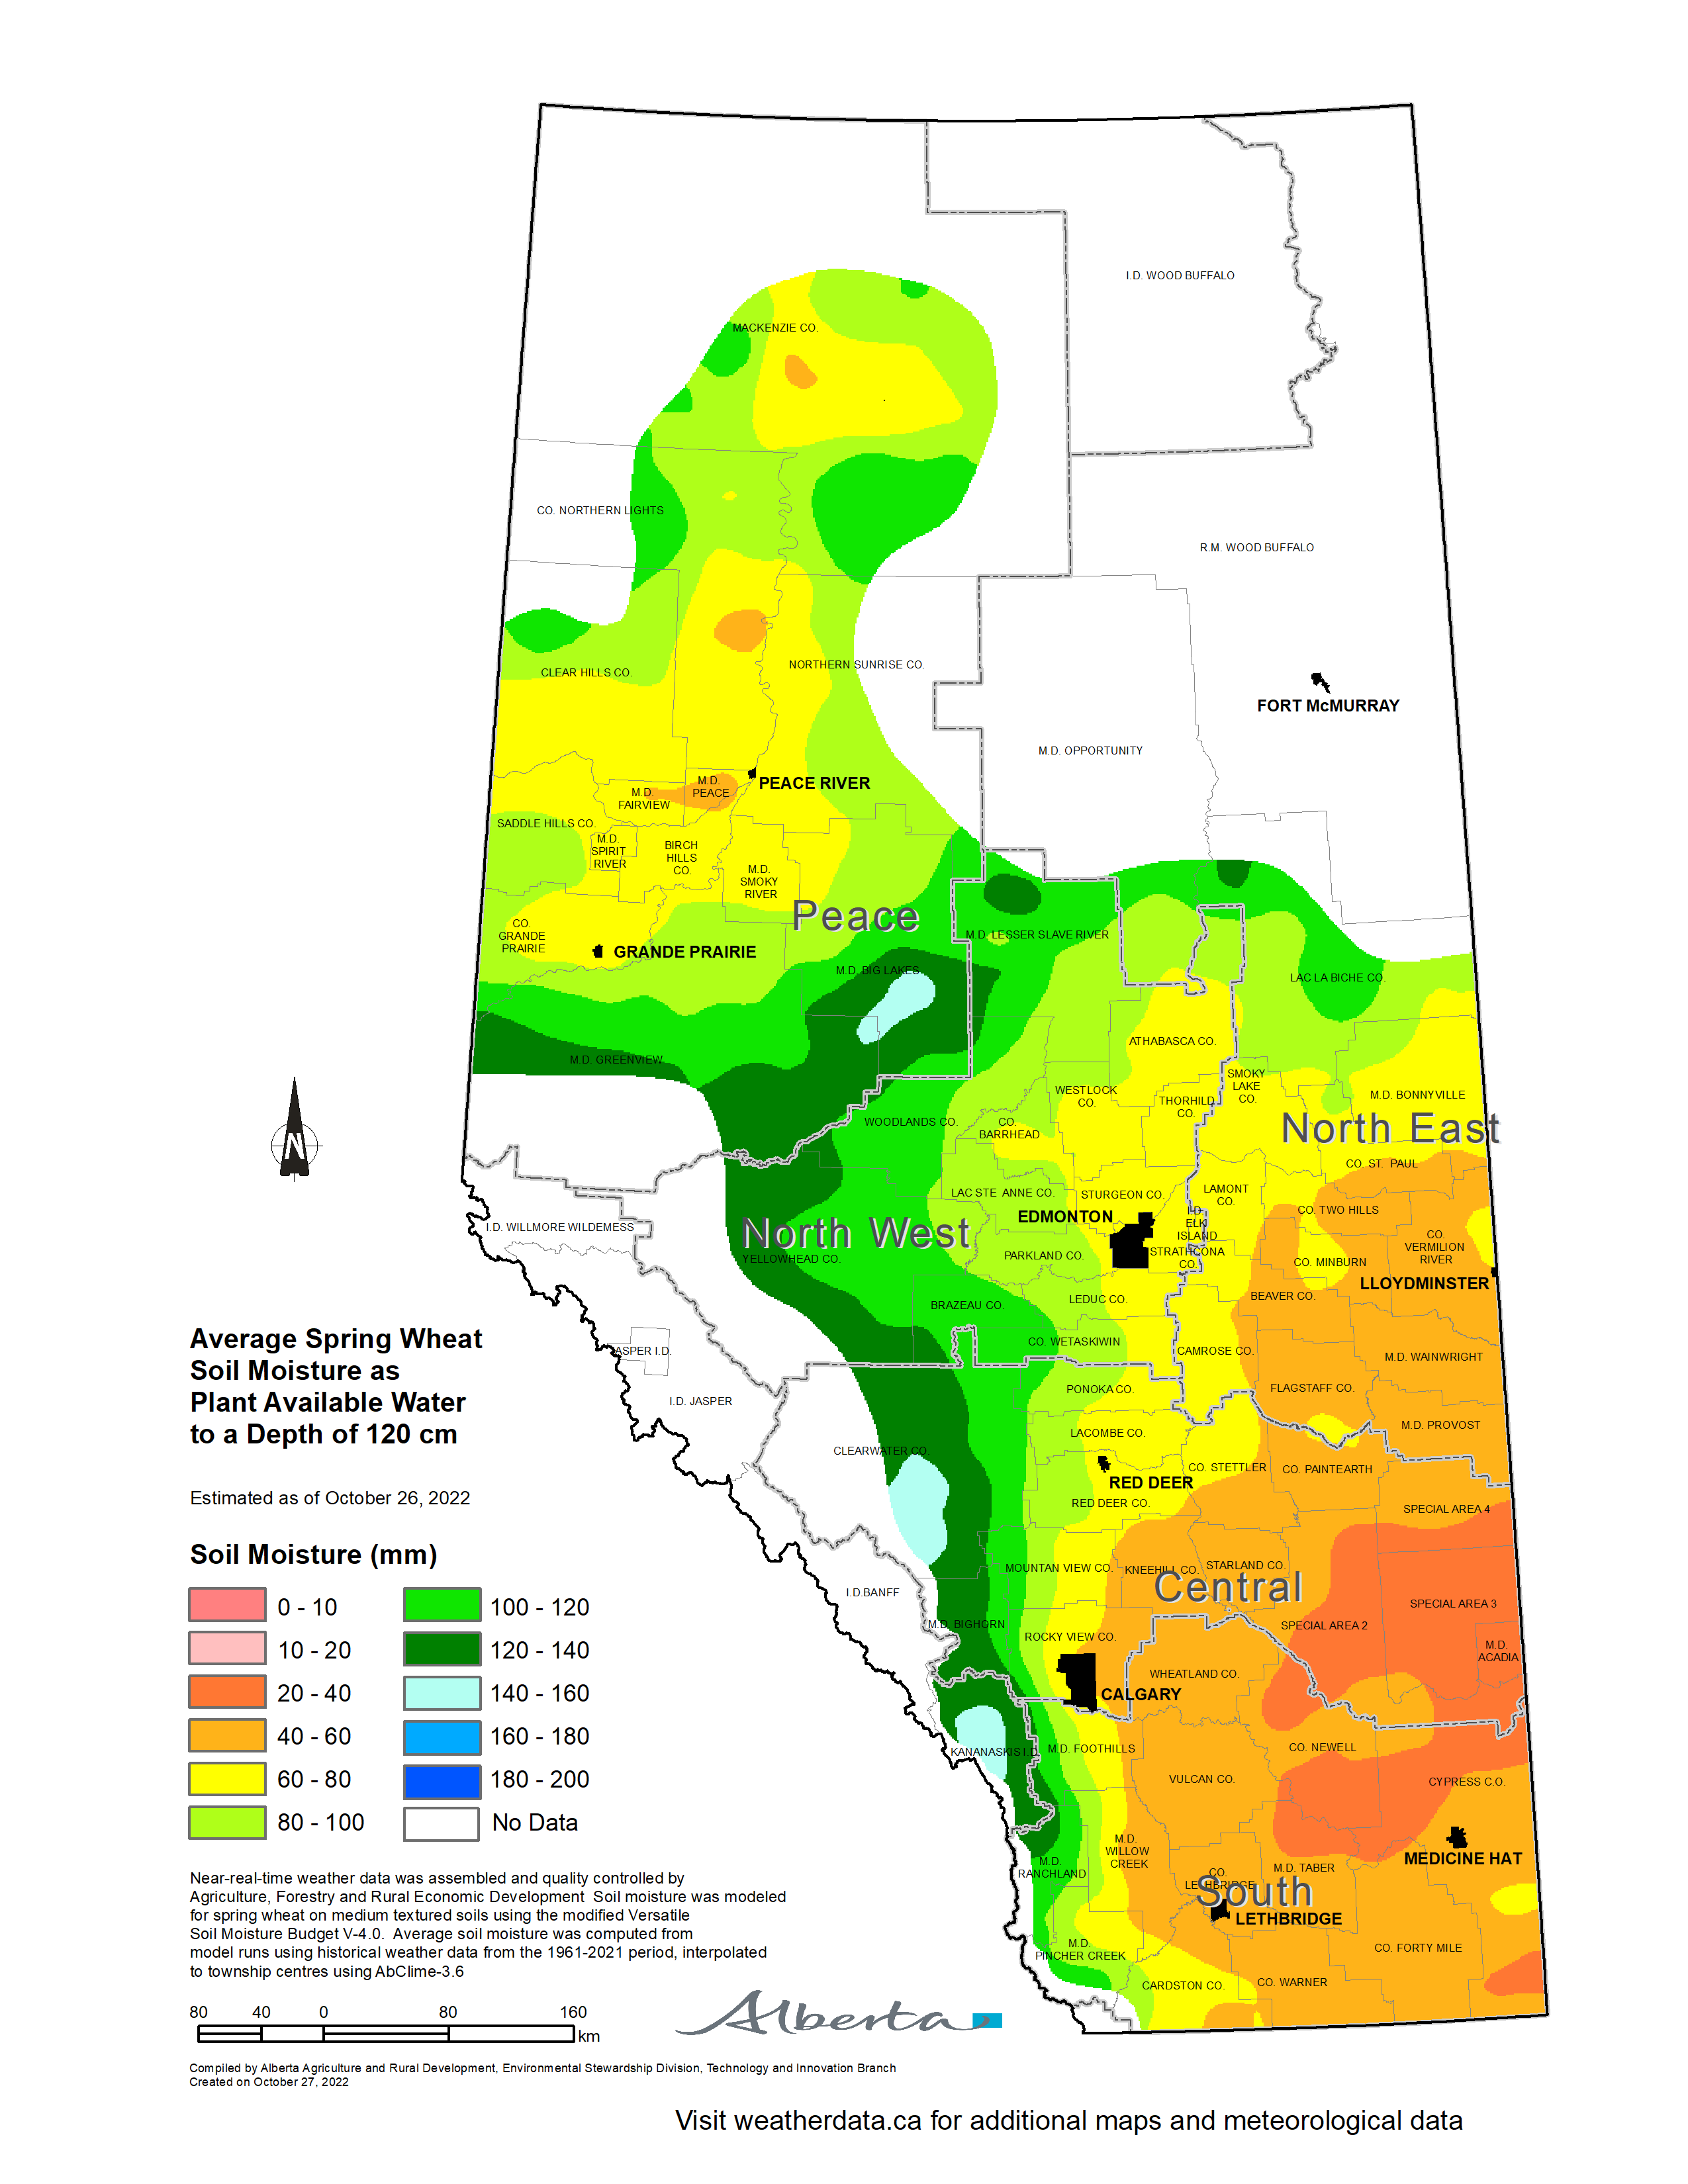
Map 2: Average Spring Wheat Soil Moisture as Plant Available Water to a Depth of 120cm
(estimated as of Oct. 26, 2022)

Map 3: Spring Wheat Soil Moisture Departure from Normal to a Depth of 120cm
(estimated as of Oct. 26, 2022)

Map 4: 60-day Precipitation Accumulations Relative to Long Term Normal
(Aug. 28, 2022 - Oct. 26, 2022)
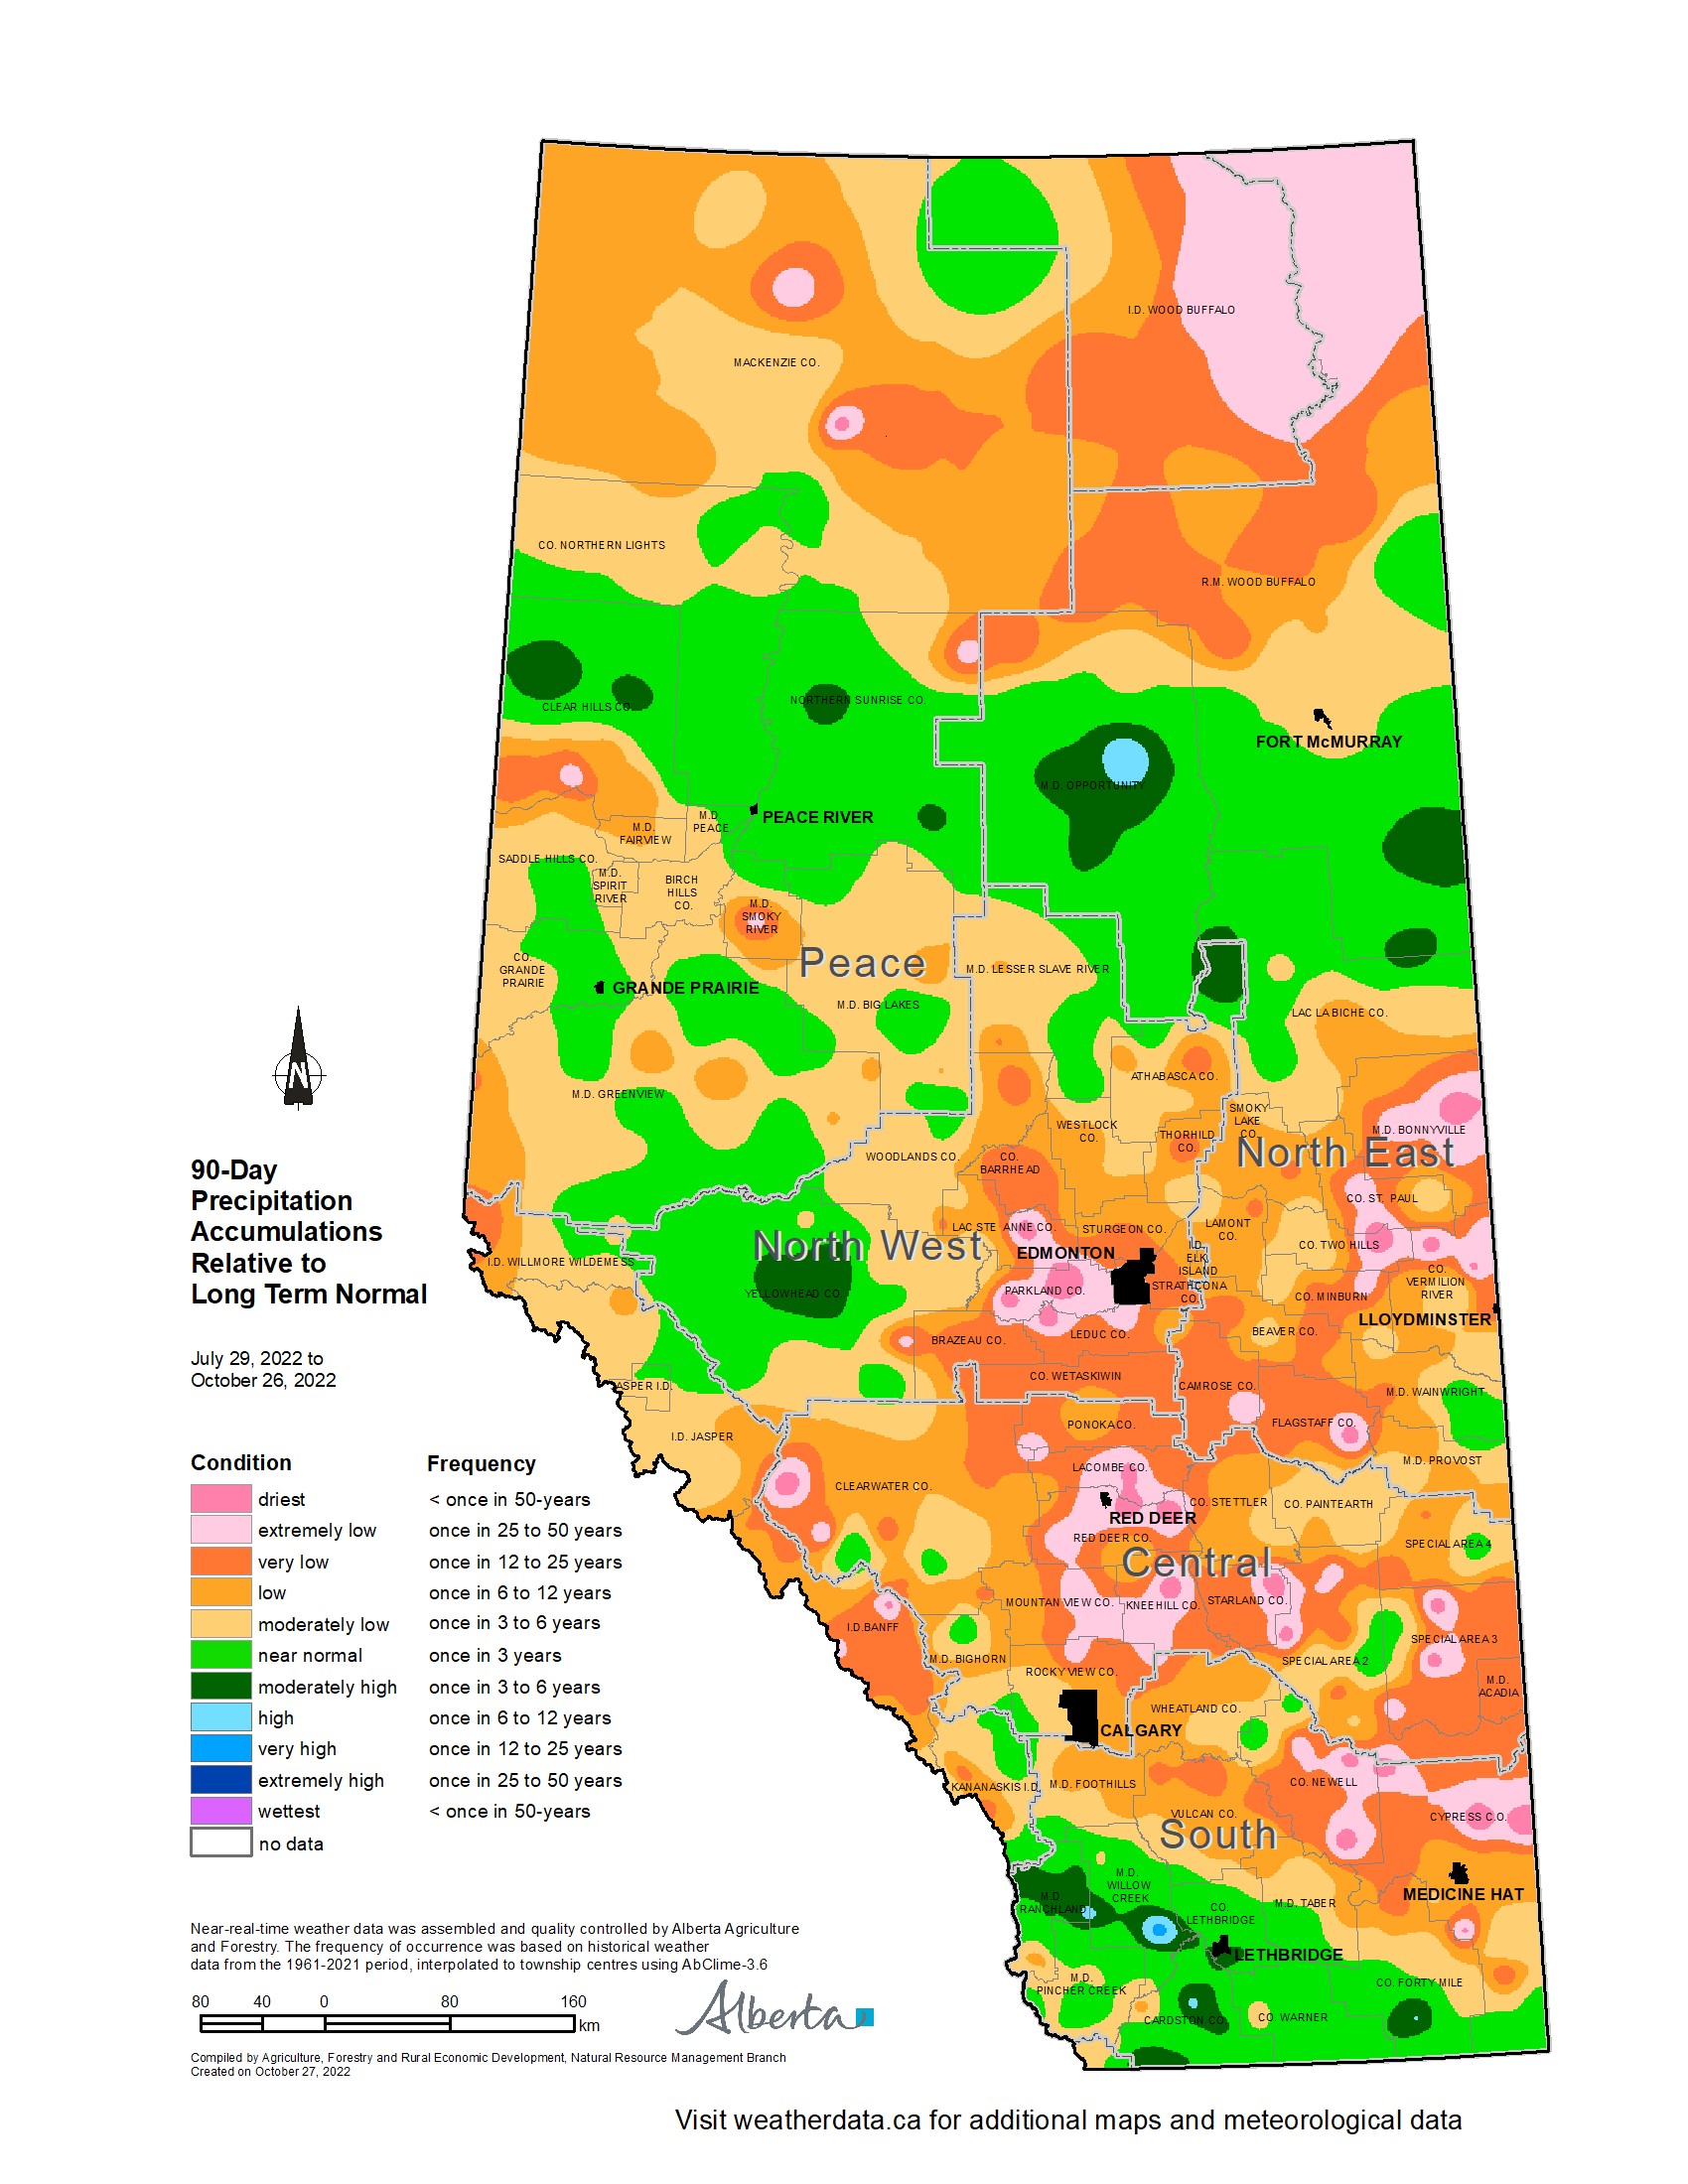
Map 5: 90-day Precipitation Accumulations Relative to Long Term Normal
(Jul. 29, 2022 - Oct. 26, 2022)

Map 6: 60-day Precipitation Accumulations Relative to Long Term Normal
(May 27, 2022 - Jul. 25, 2022)
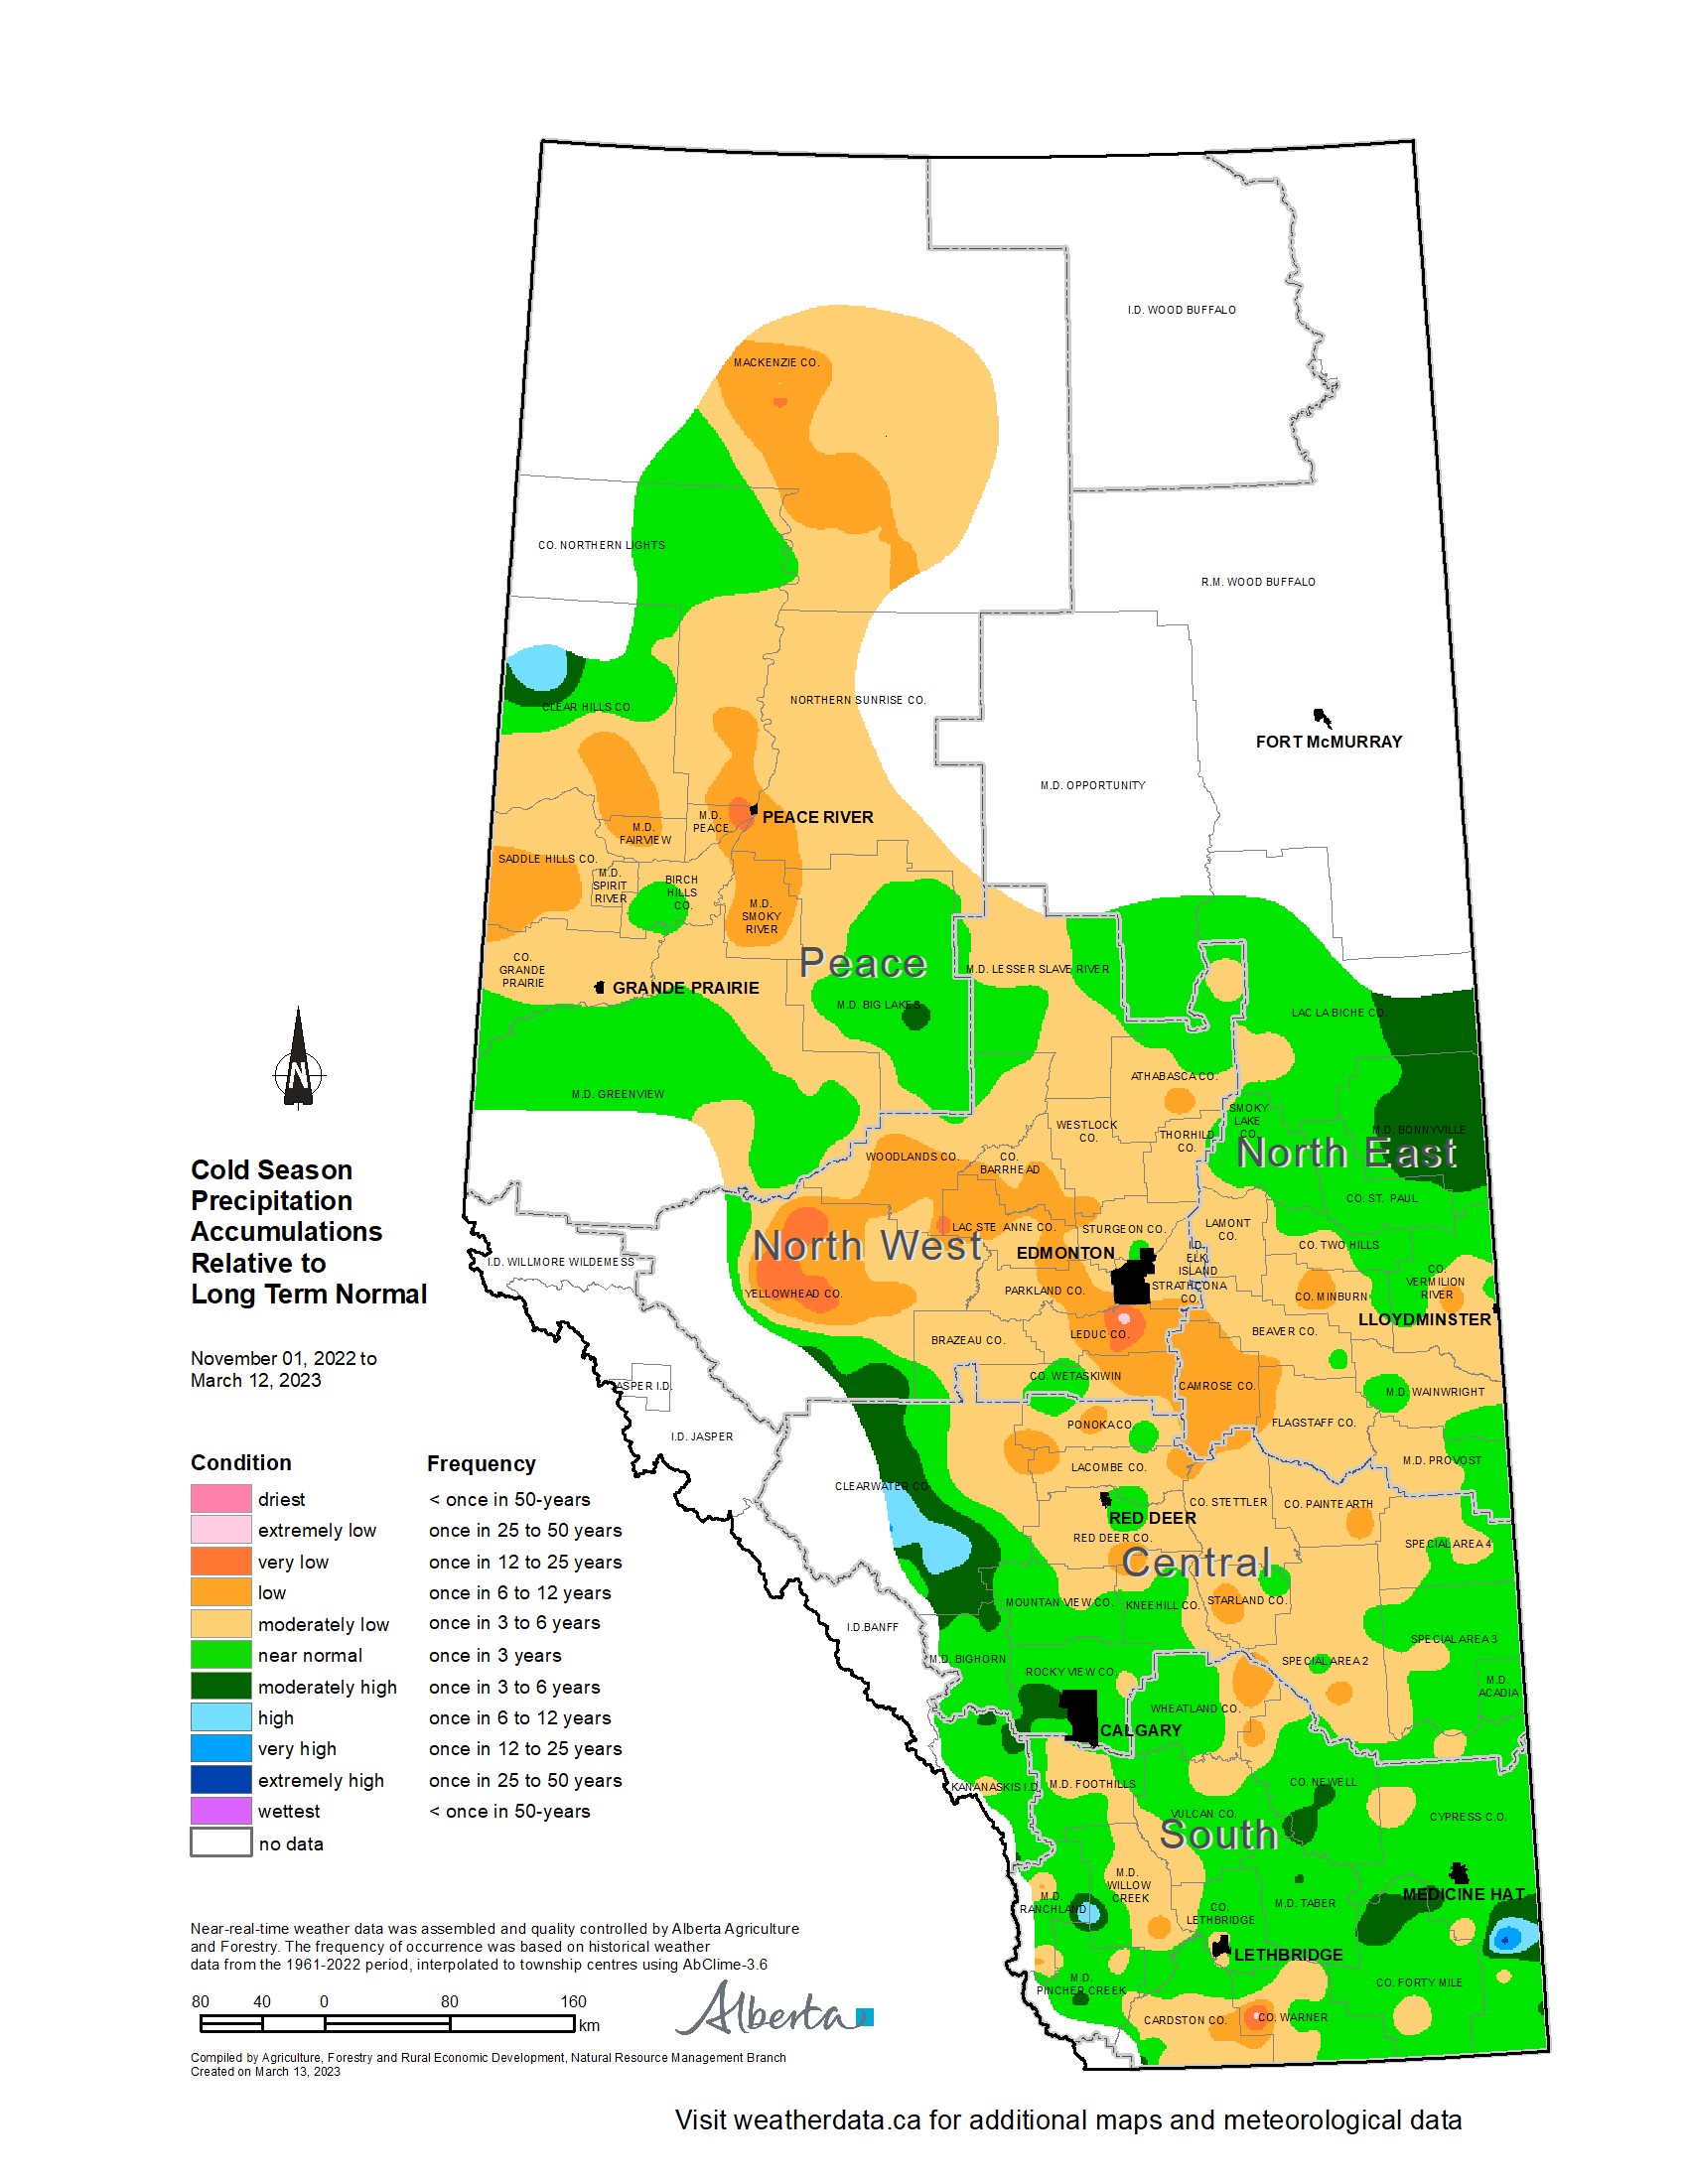
Map 7: Cold Season Precipitation Accumulations Relative to Long Term Normal
(Nov. 1, 2022 - Mar. 12, 2023)

Map 8: Cold Season Precipitation to Date
(Nov. 1, 2022 - Mar. 12, 2023)
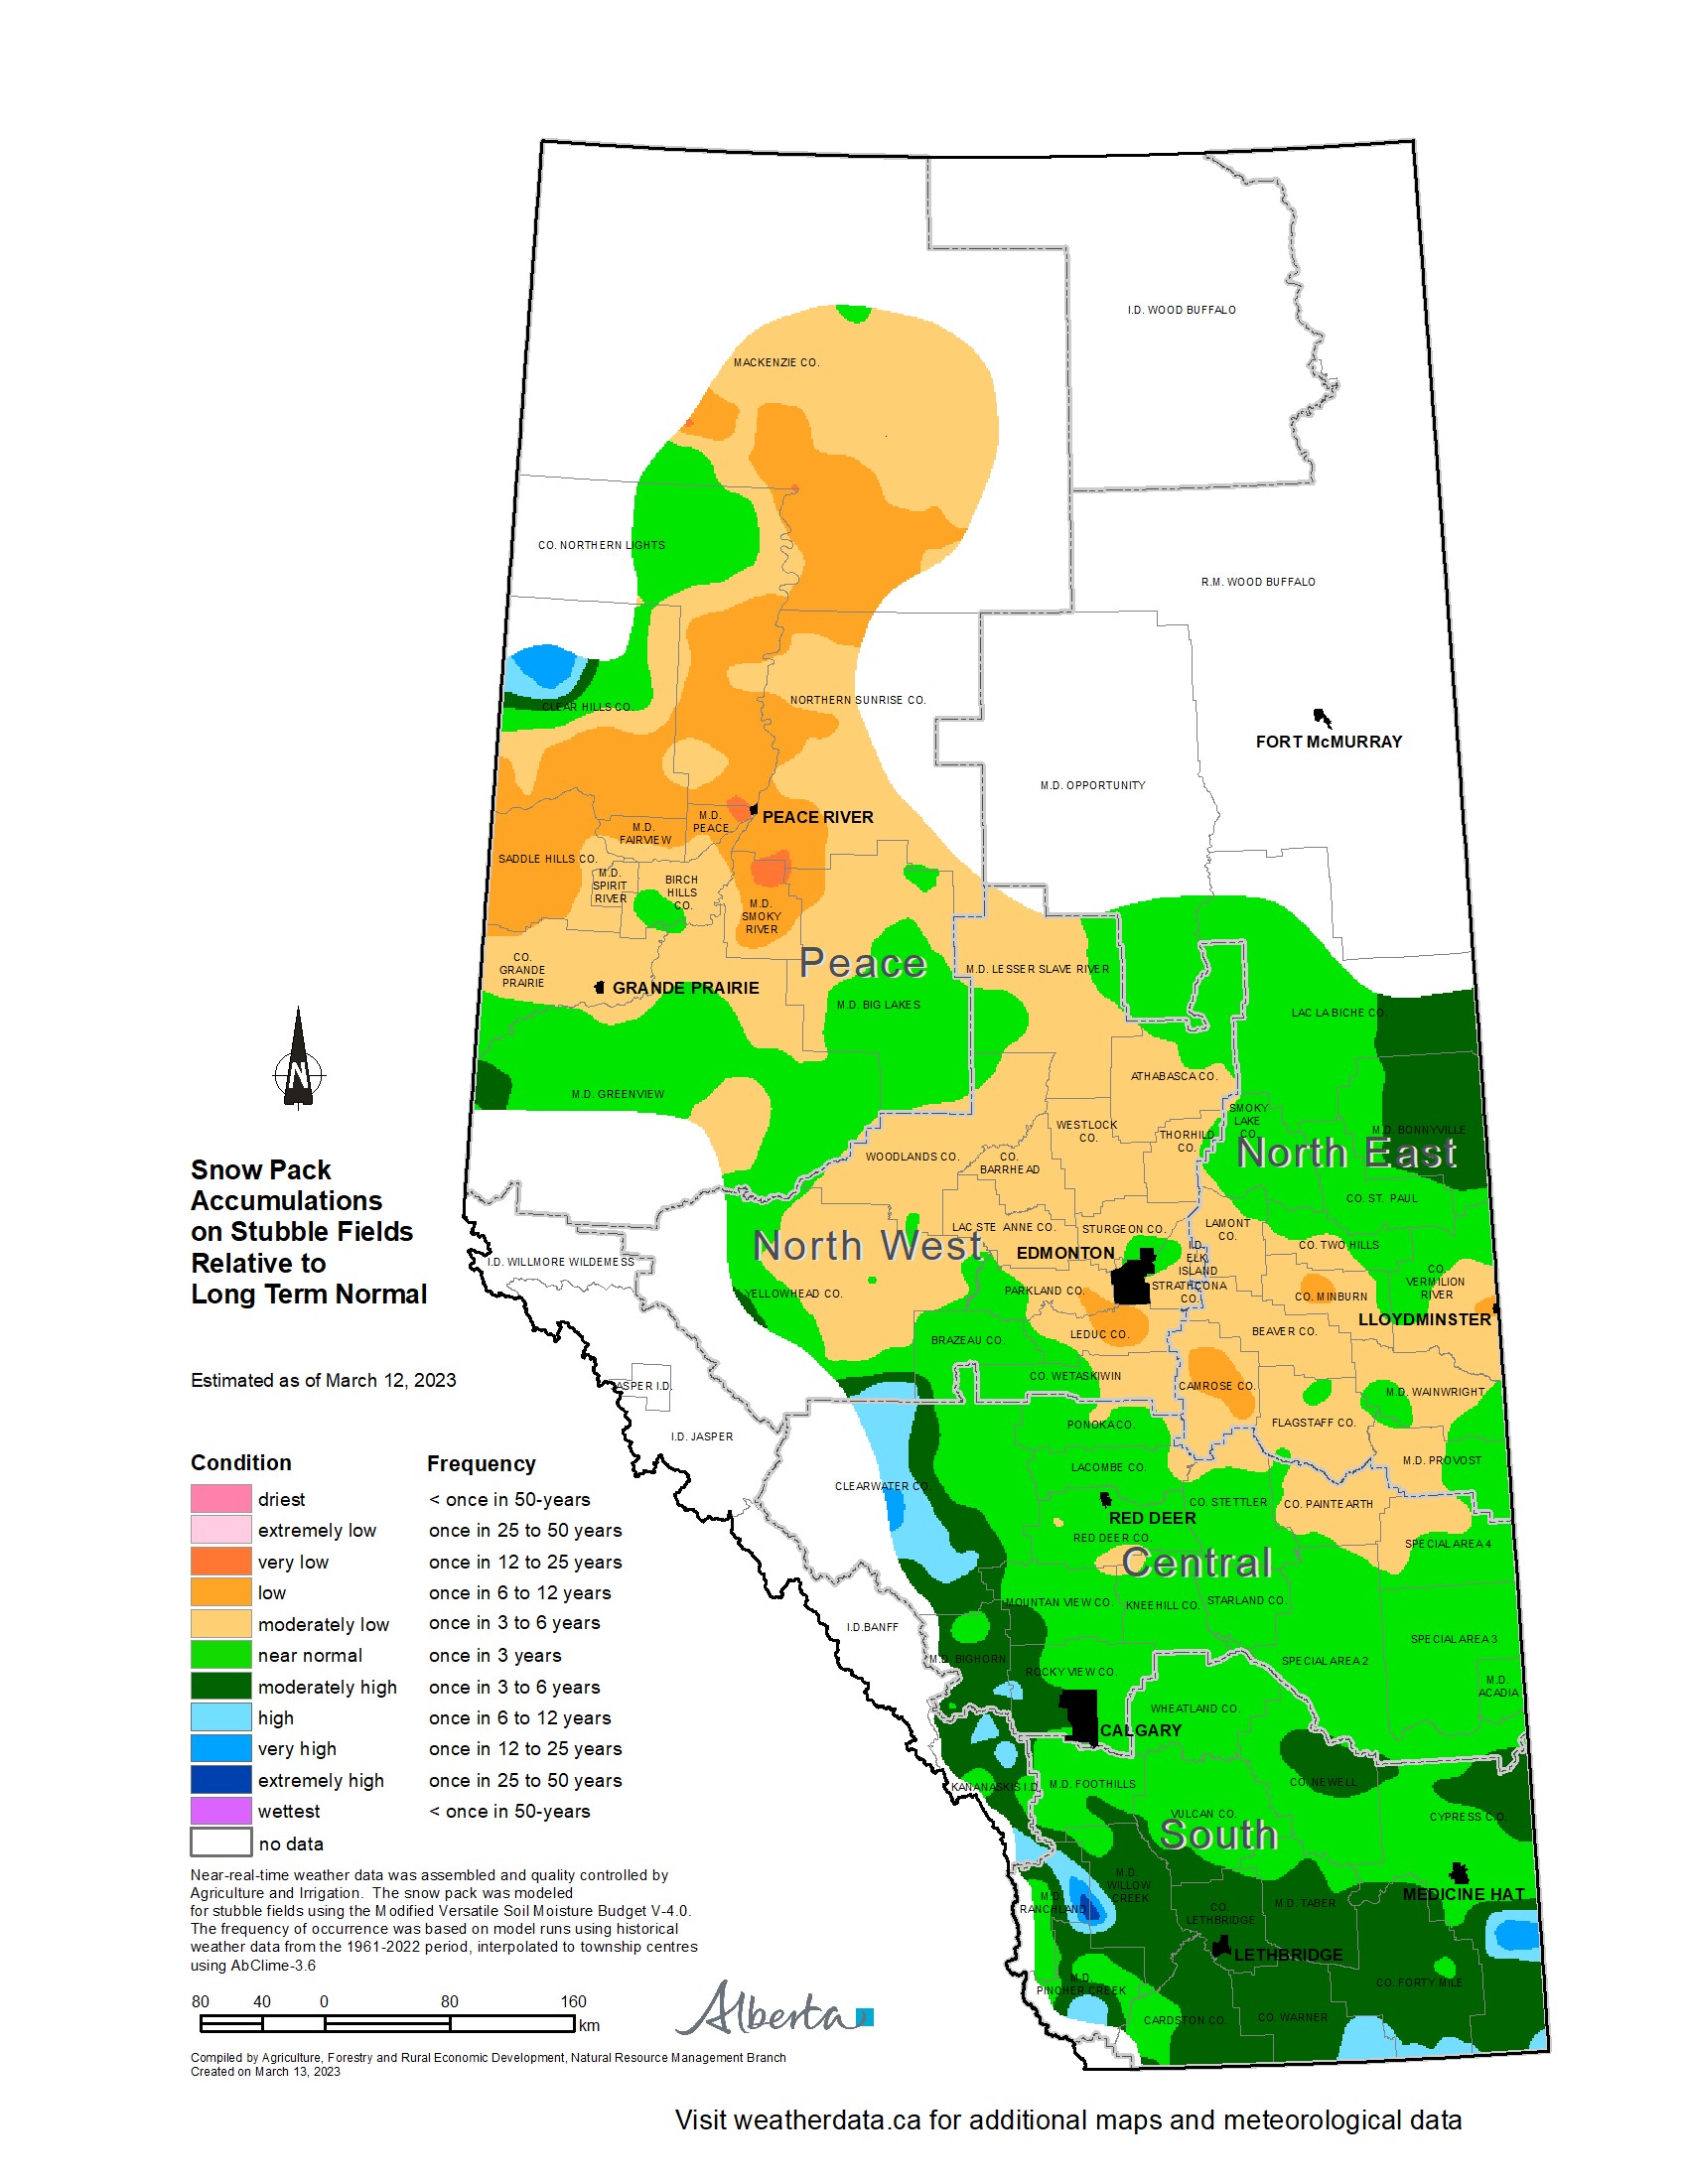
Map 9: Snow Pack Accumulations on Stubble Fields Relative to Long Term Normal
(estimated as of Mar. 12, 2023)
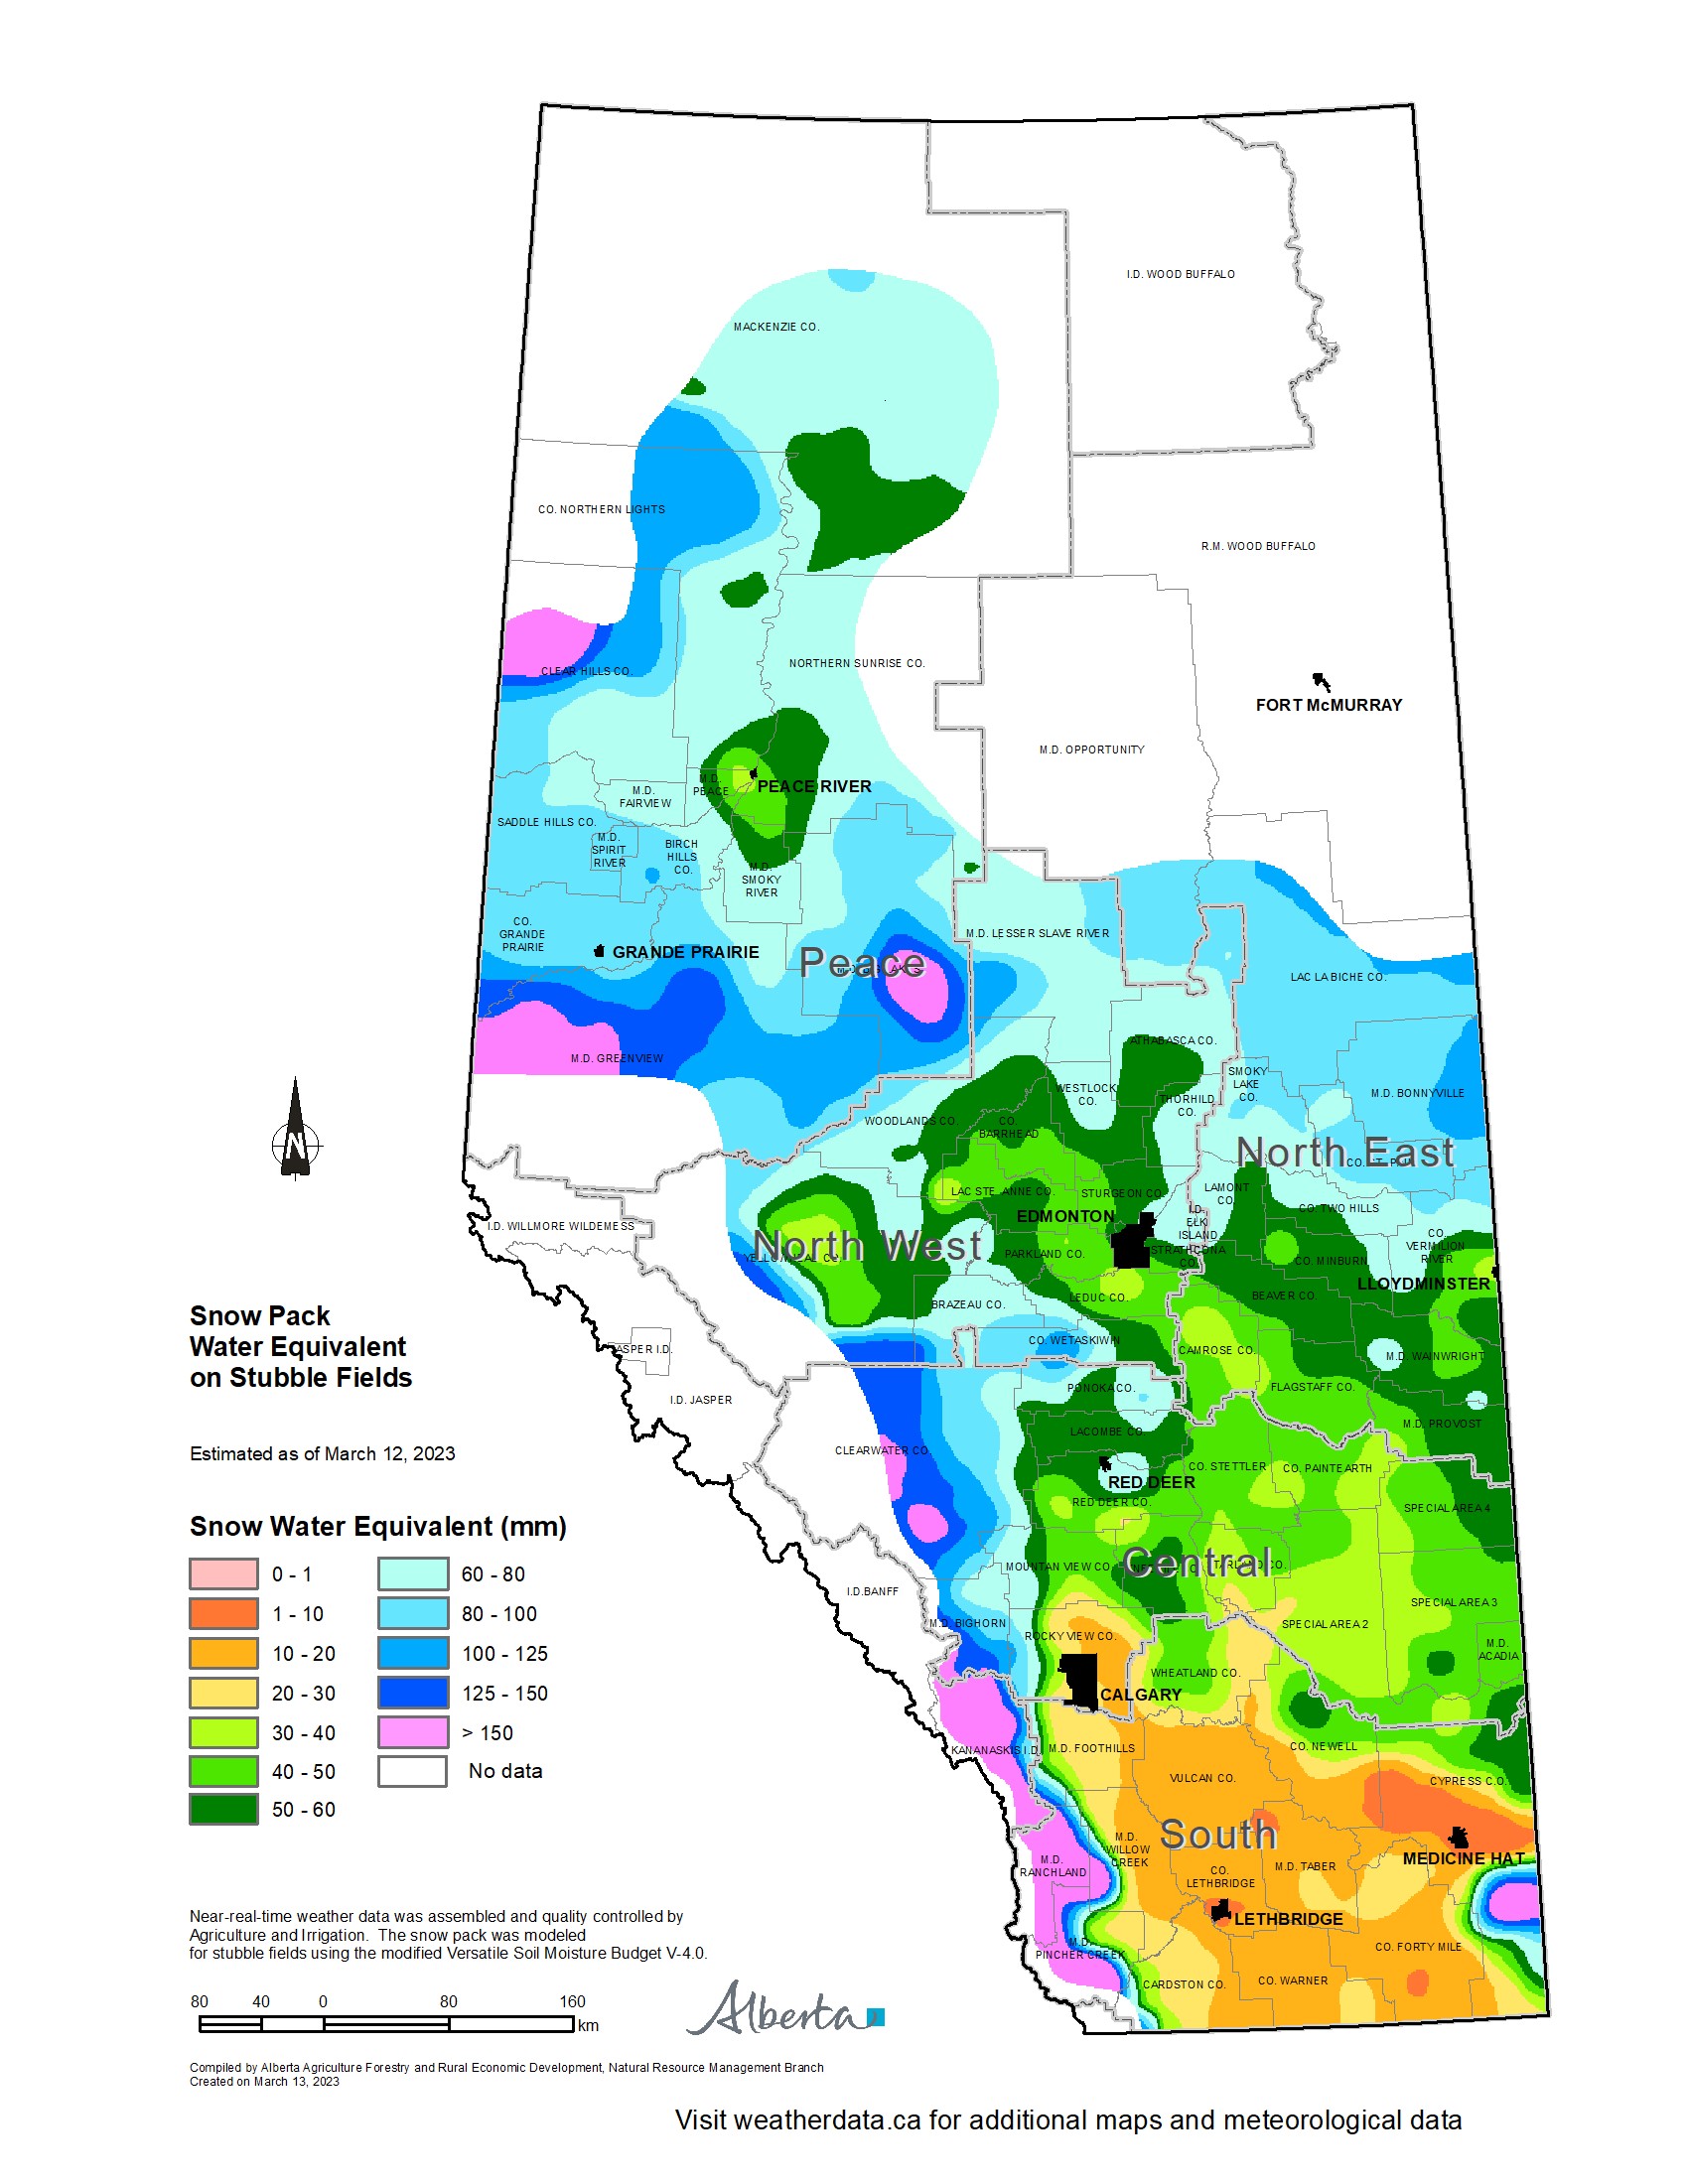
Map 10: Snow Pack Water Equivalent on Stubble Fields
(estimated as of Mar. 12, 2023)
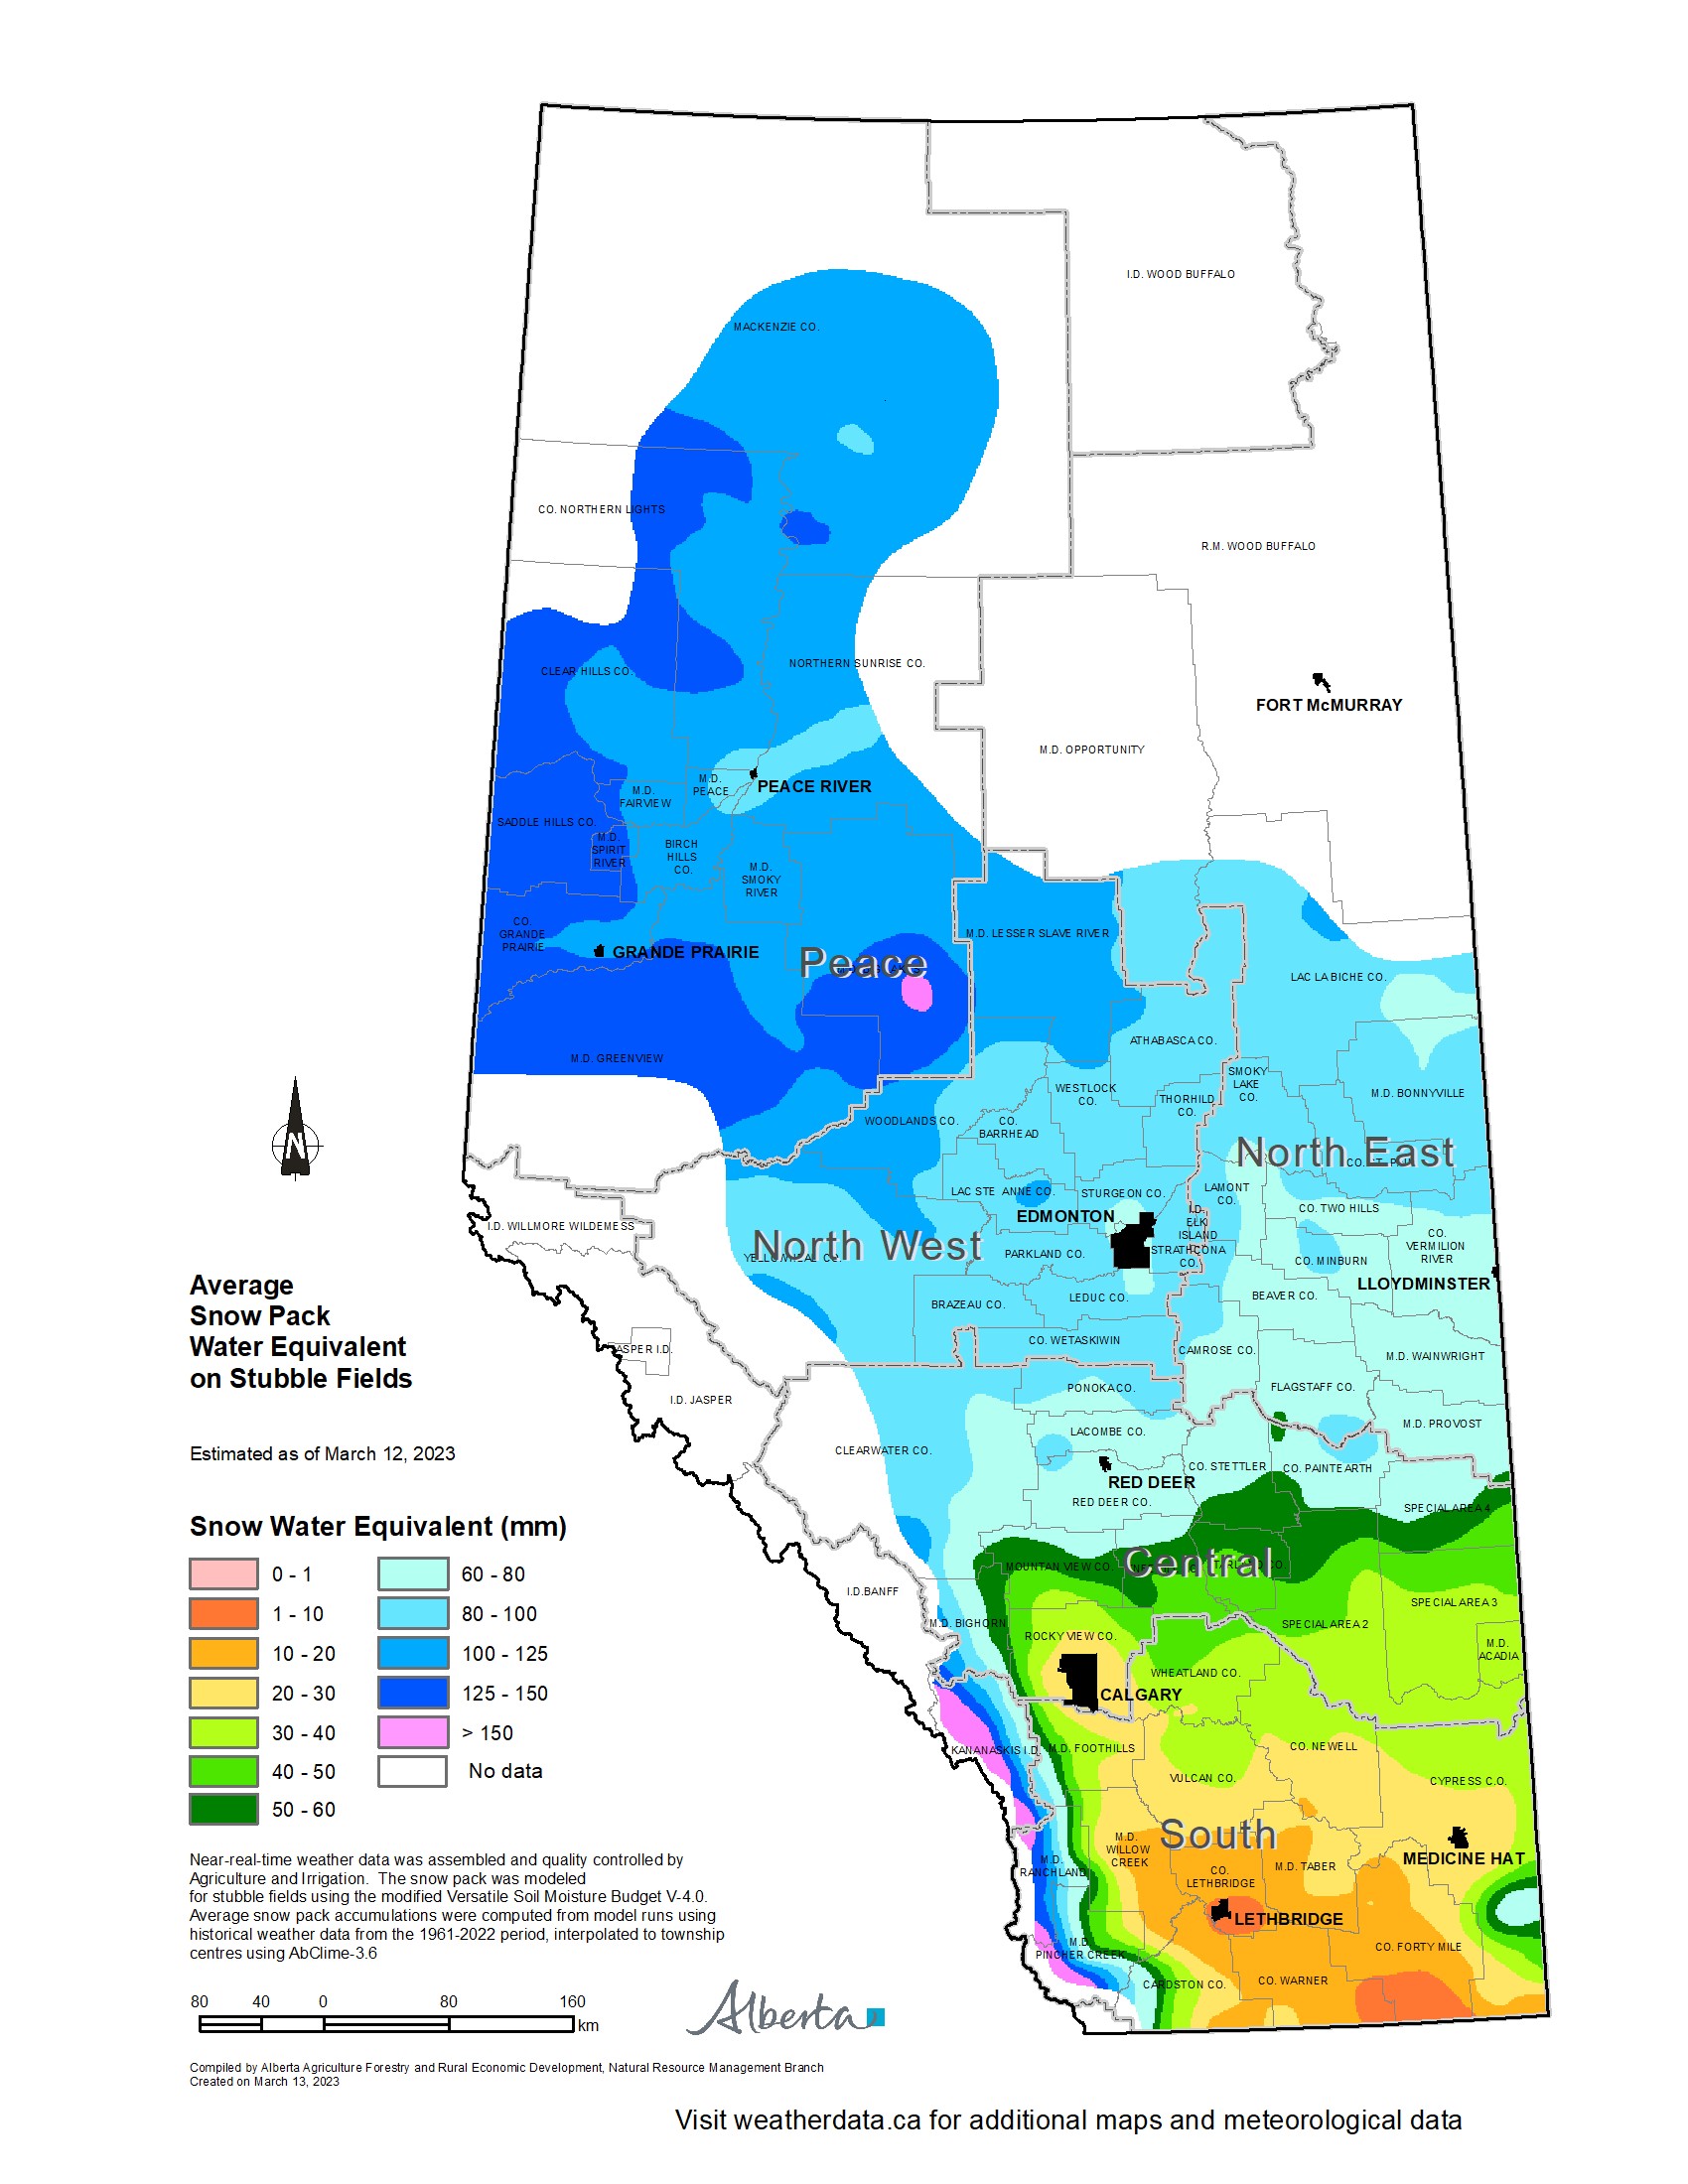
Map 11: Average Snow Pack Water Equivalent on Stubble Fields
(estimated as of Mar. 12, 2023)
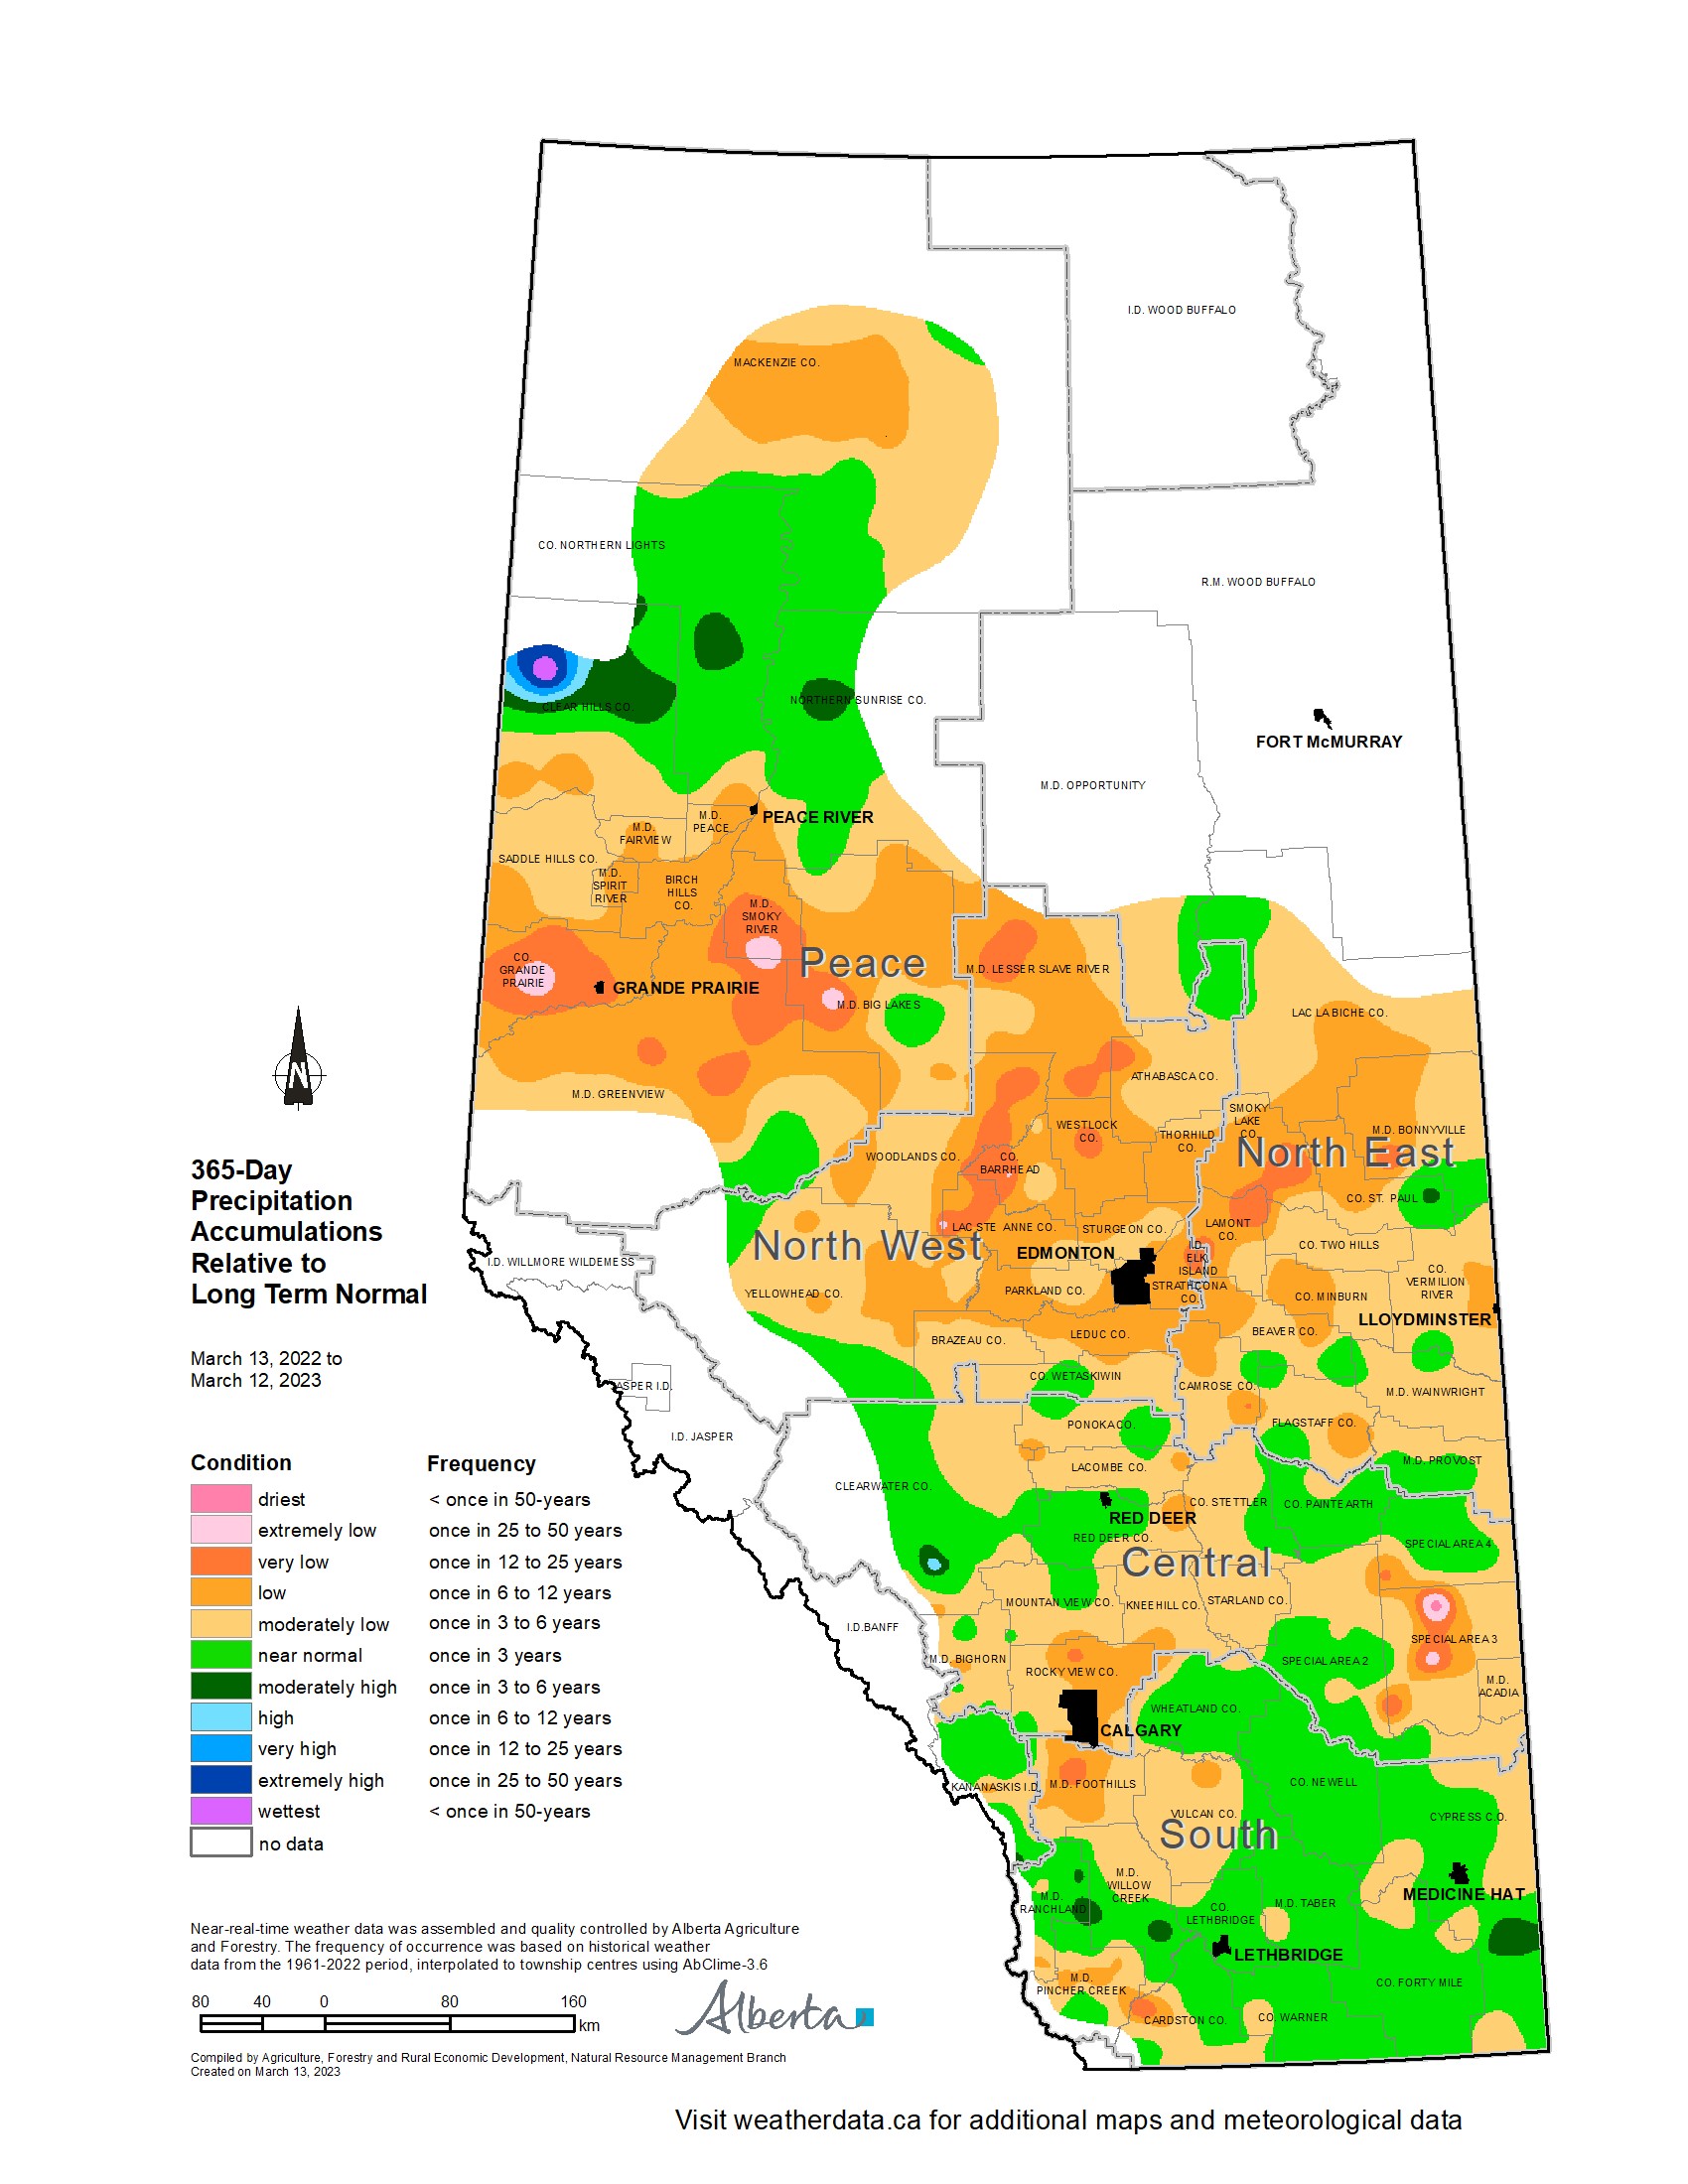
Map 12: 365-day Precipitation Accumulations Relative to Long Term Normal
(Mar. 13, 2022 - Mar. 12, 2023)
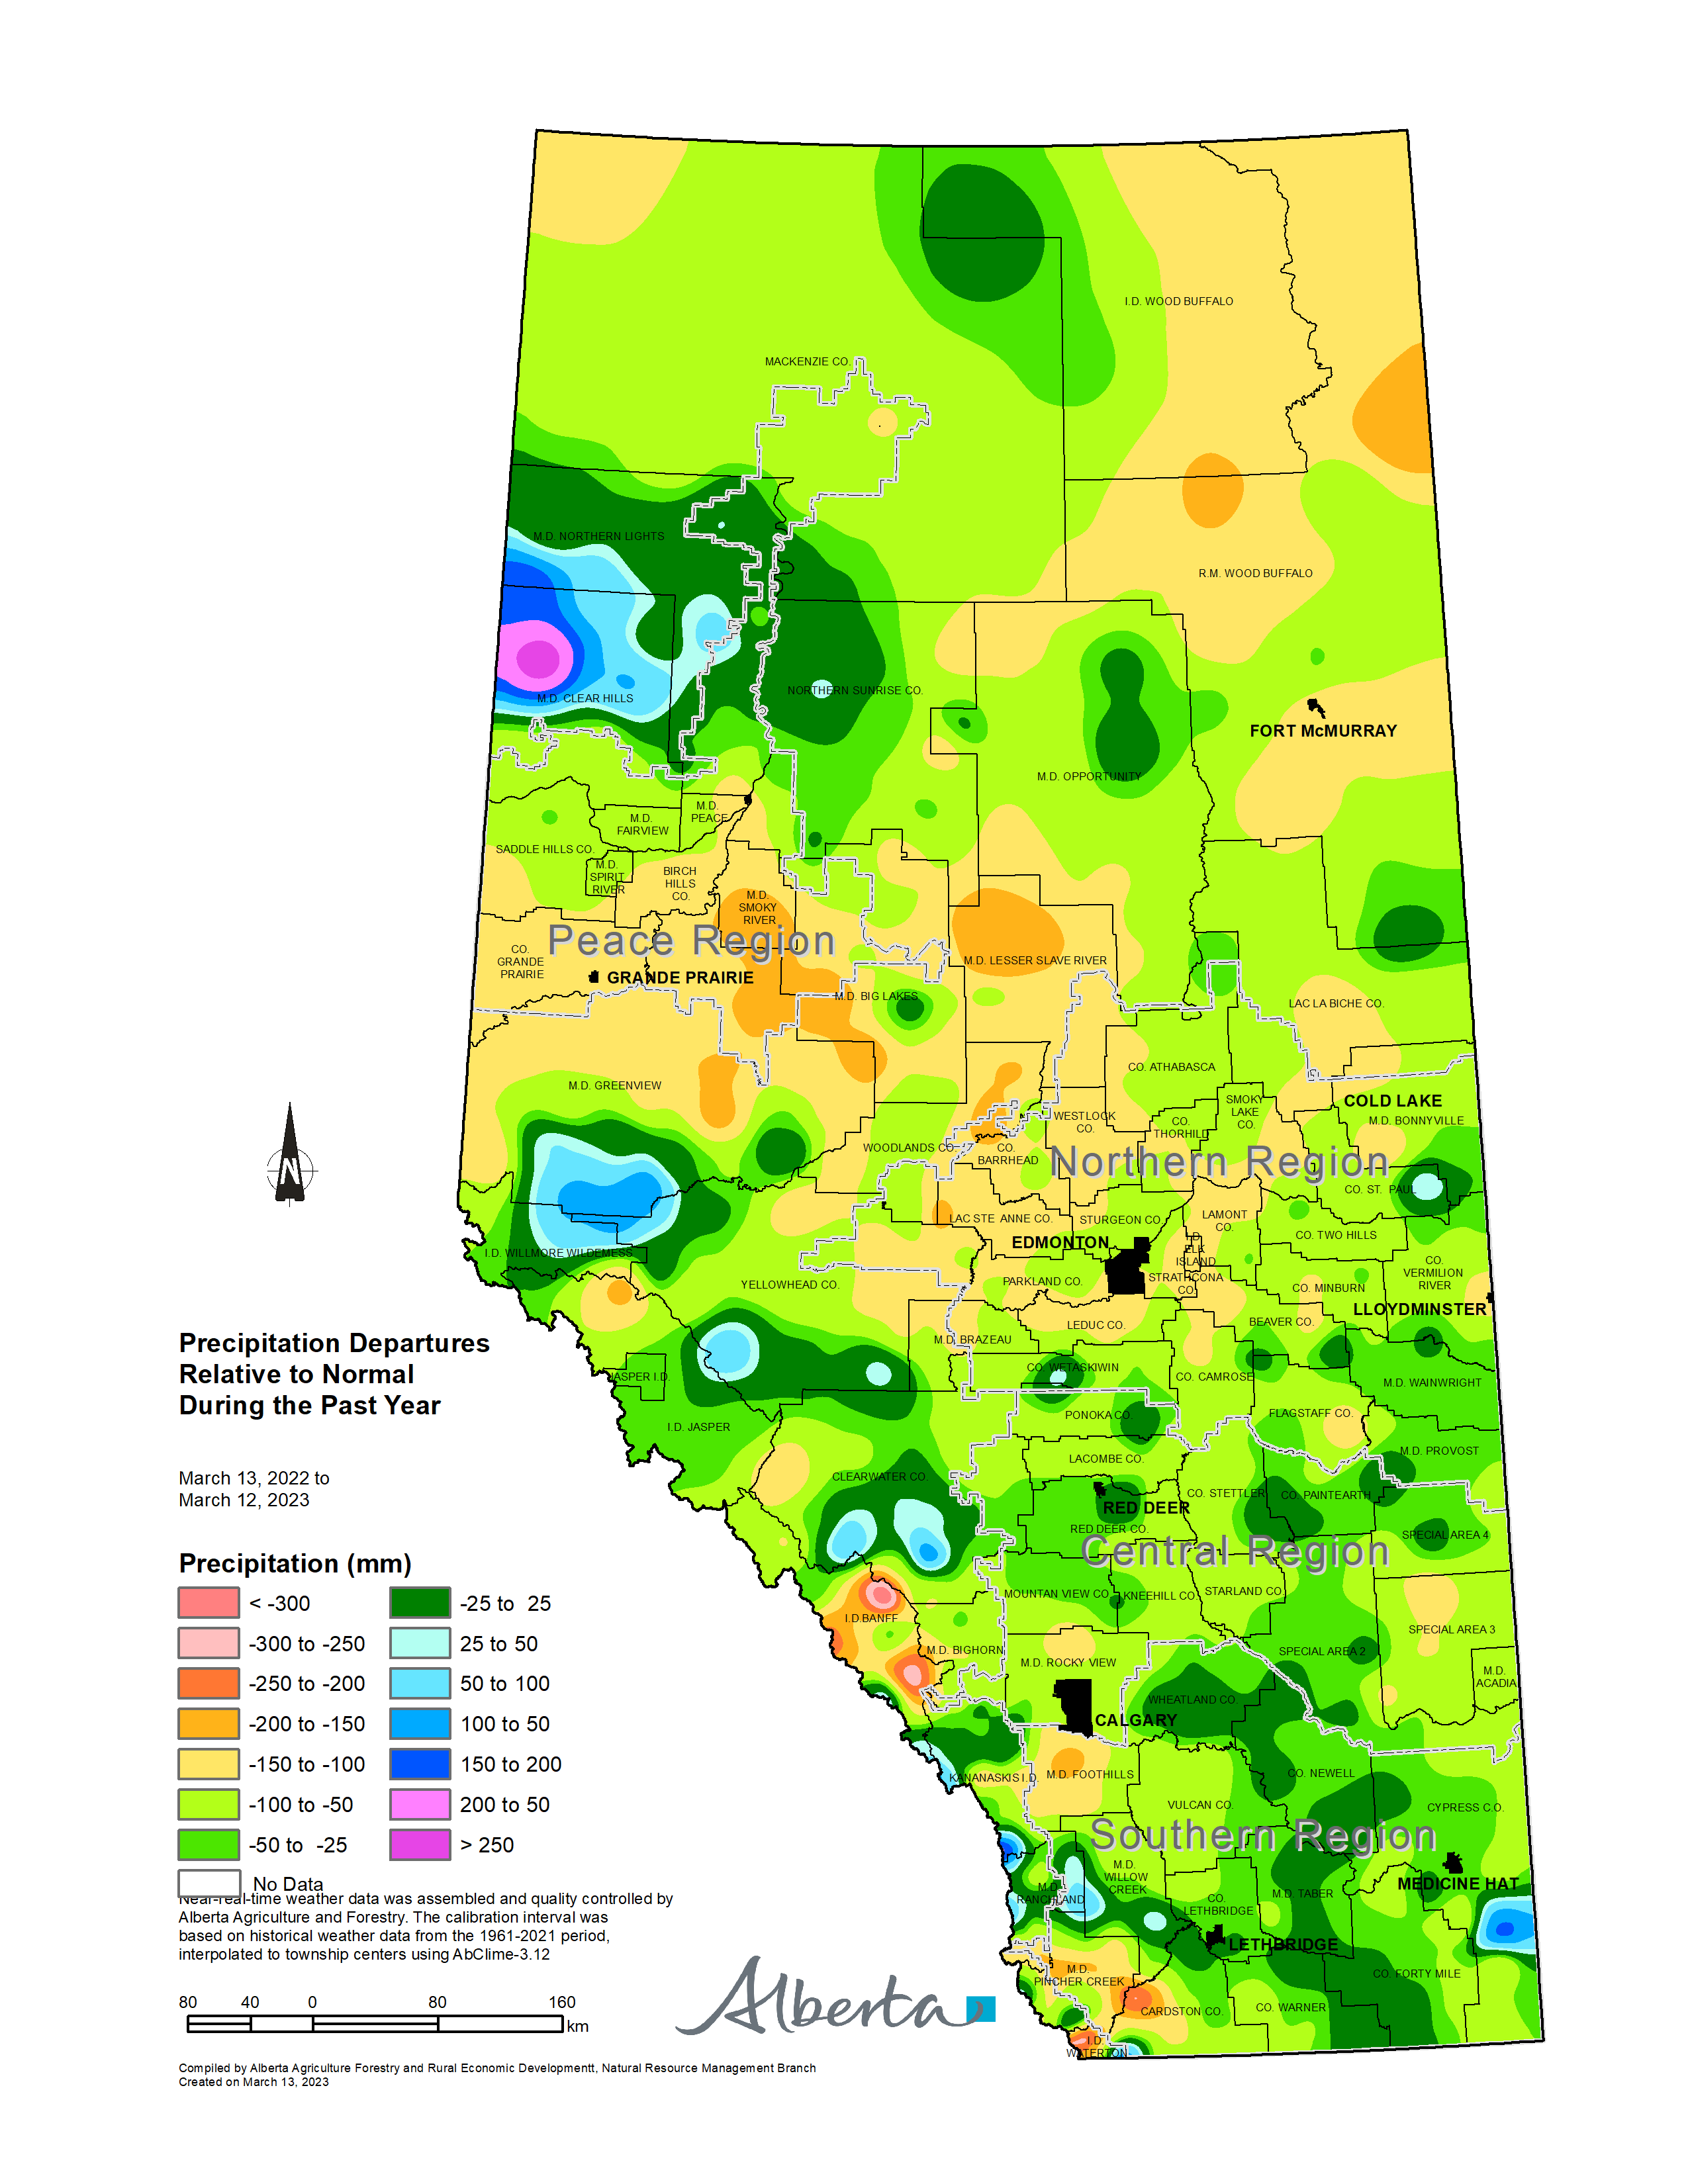
Map 13: Precipitation Departures Relative to normal During the Past Year
(Mar. 13, 2022 - Mar. 12, 2023)

Map 14: 10-year Precipitation Accumulations Relative to Long Term Normal
(Mar. 13, 2017 - Mar. 12, 2023)
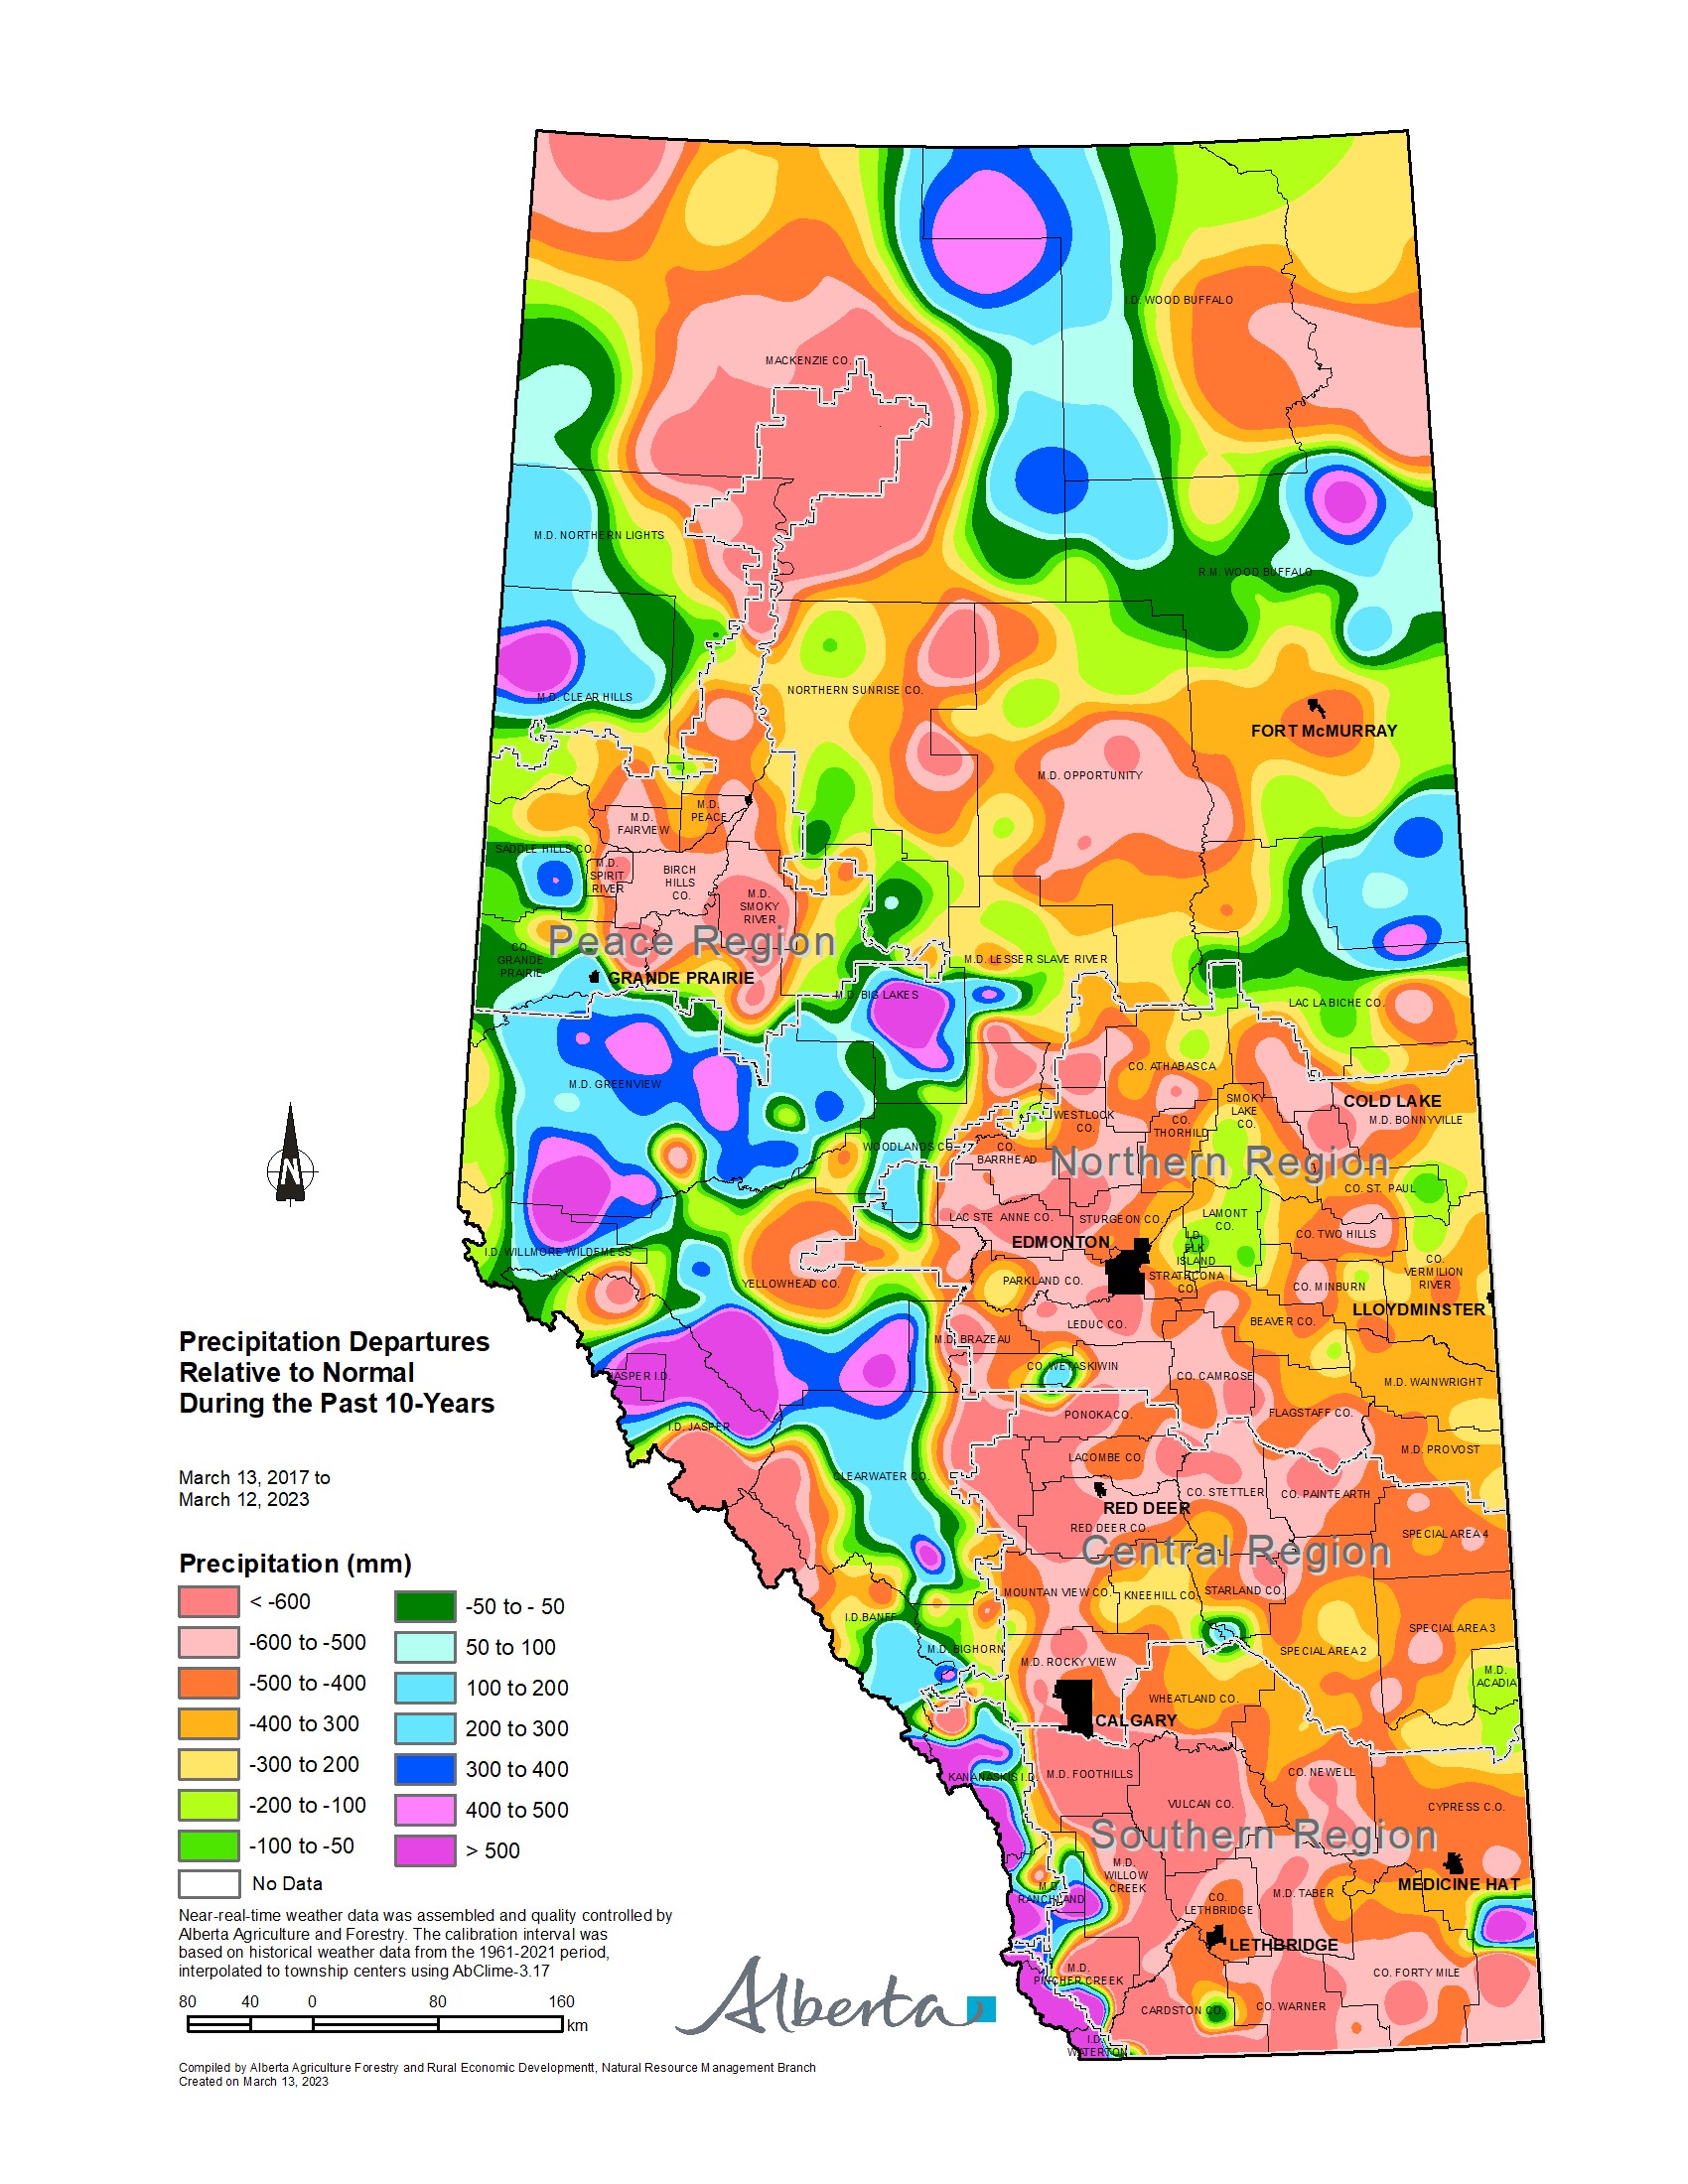
Map 15: Precipitation Depatures Relative to Normal During the Past 10-years
(Mar. 13, 2017 - Mar. 12, 2023)
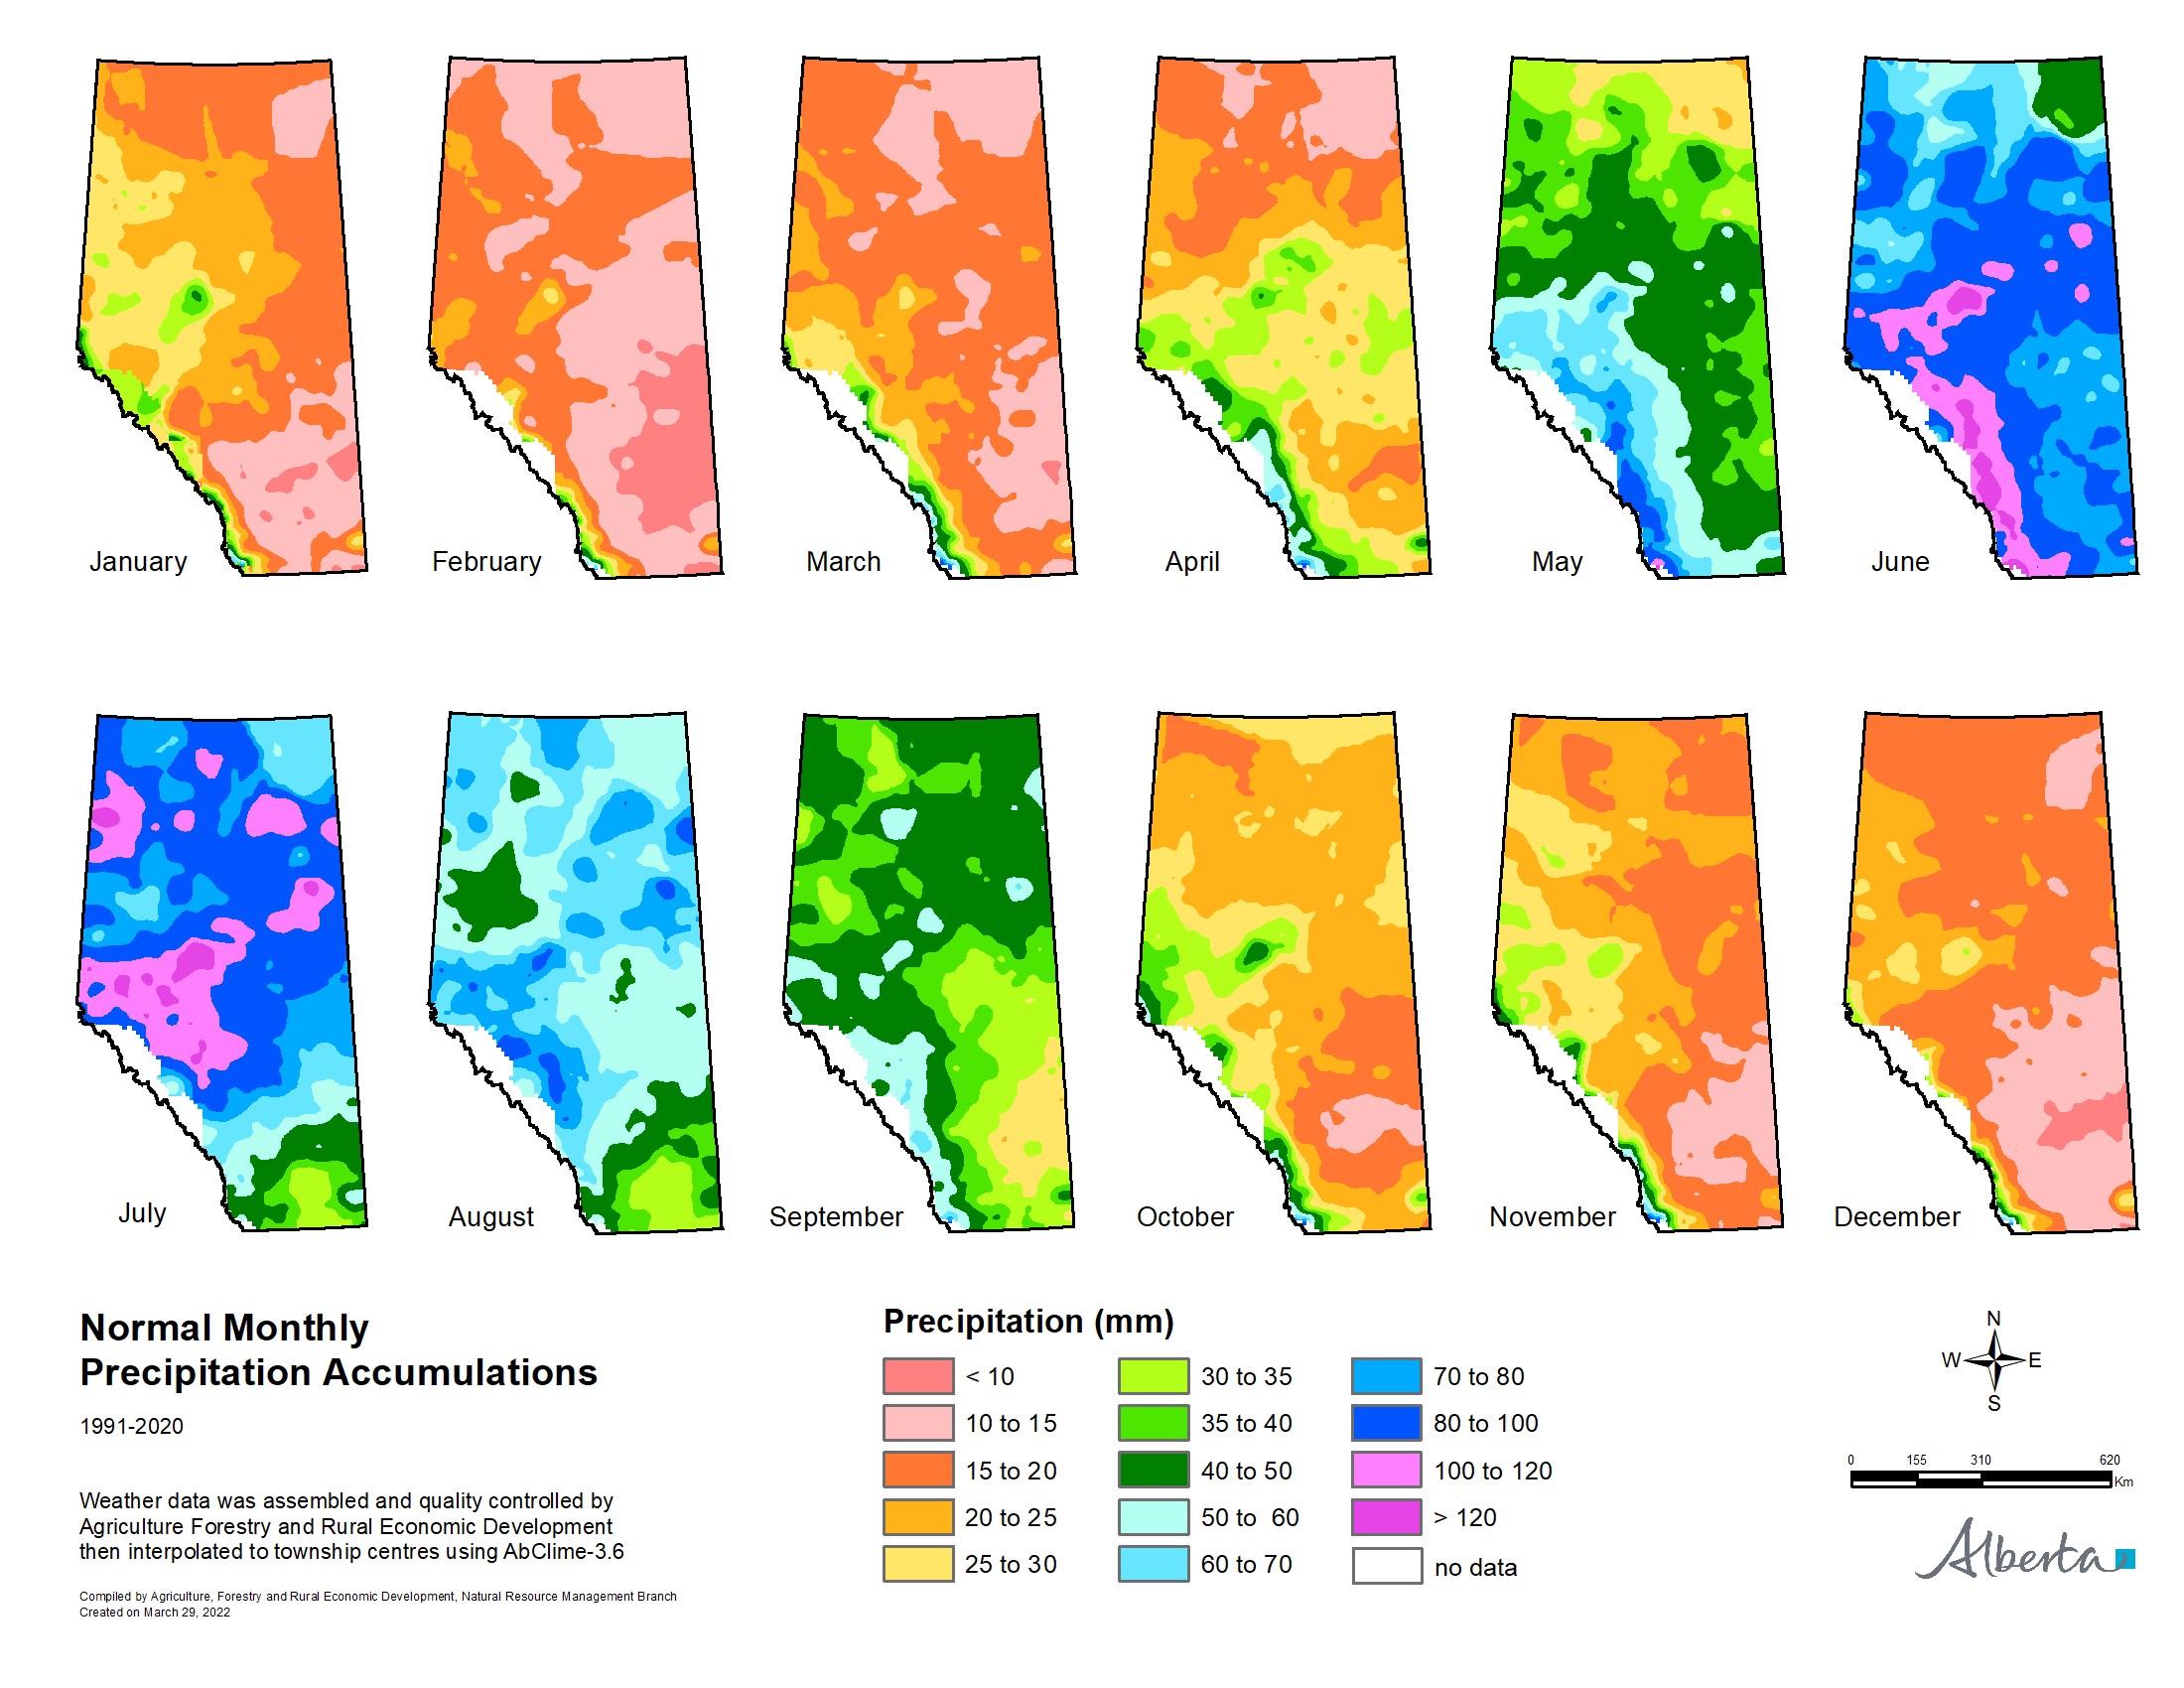
Map 16: Normal Monthly Precipitation Accumulations 1991-2020
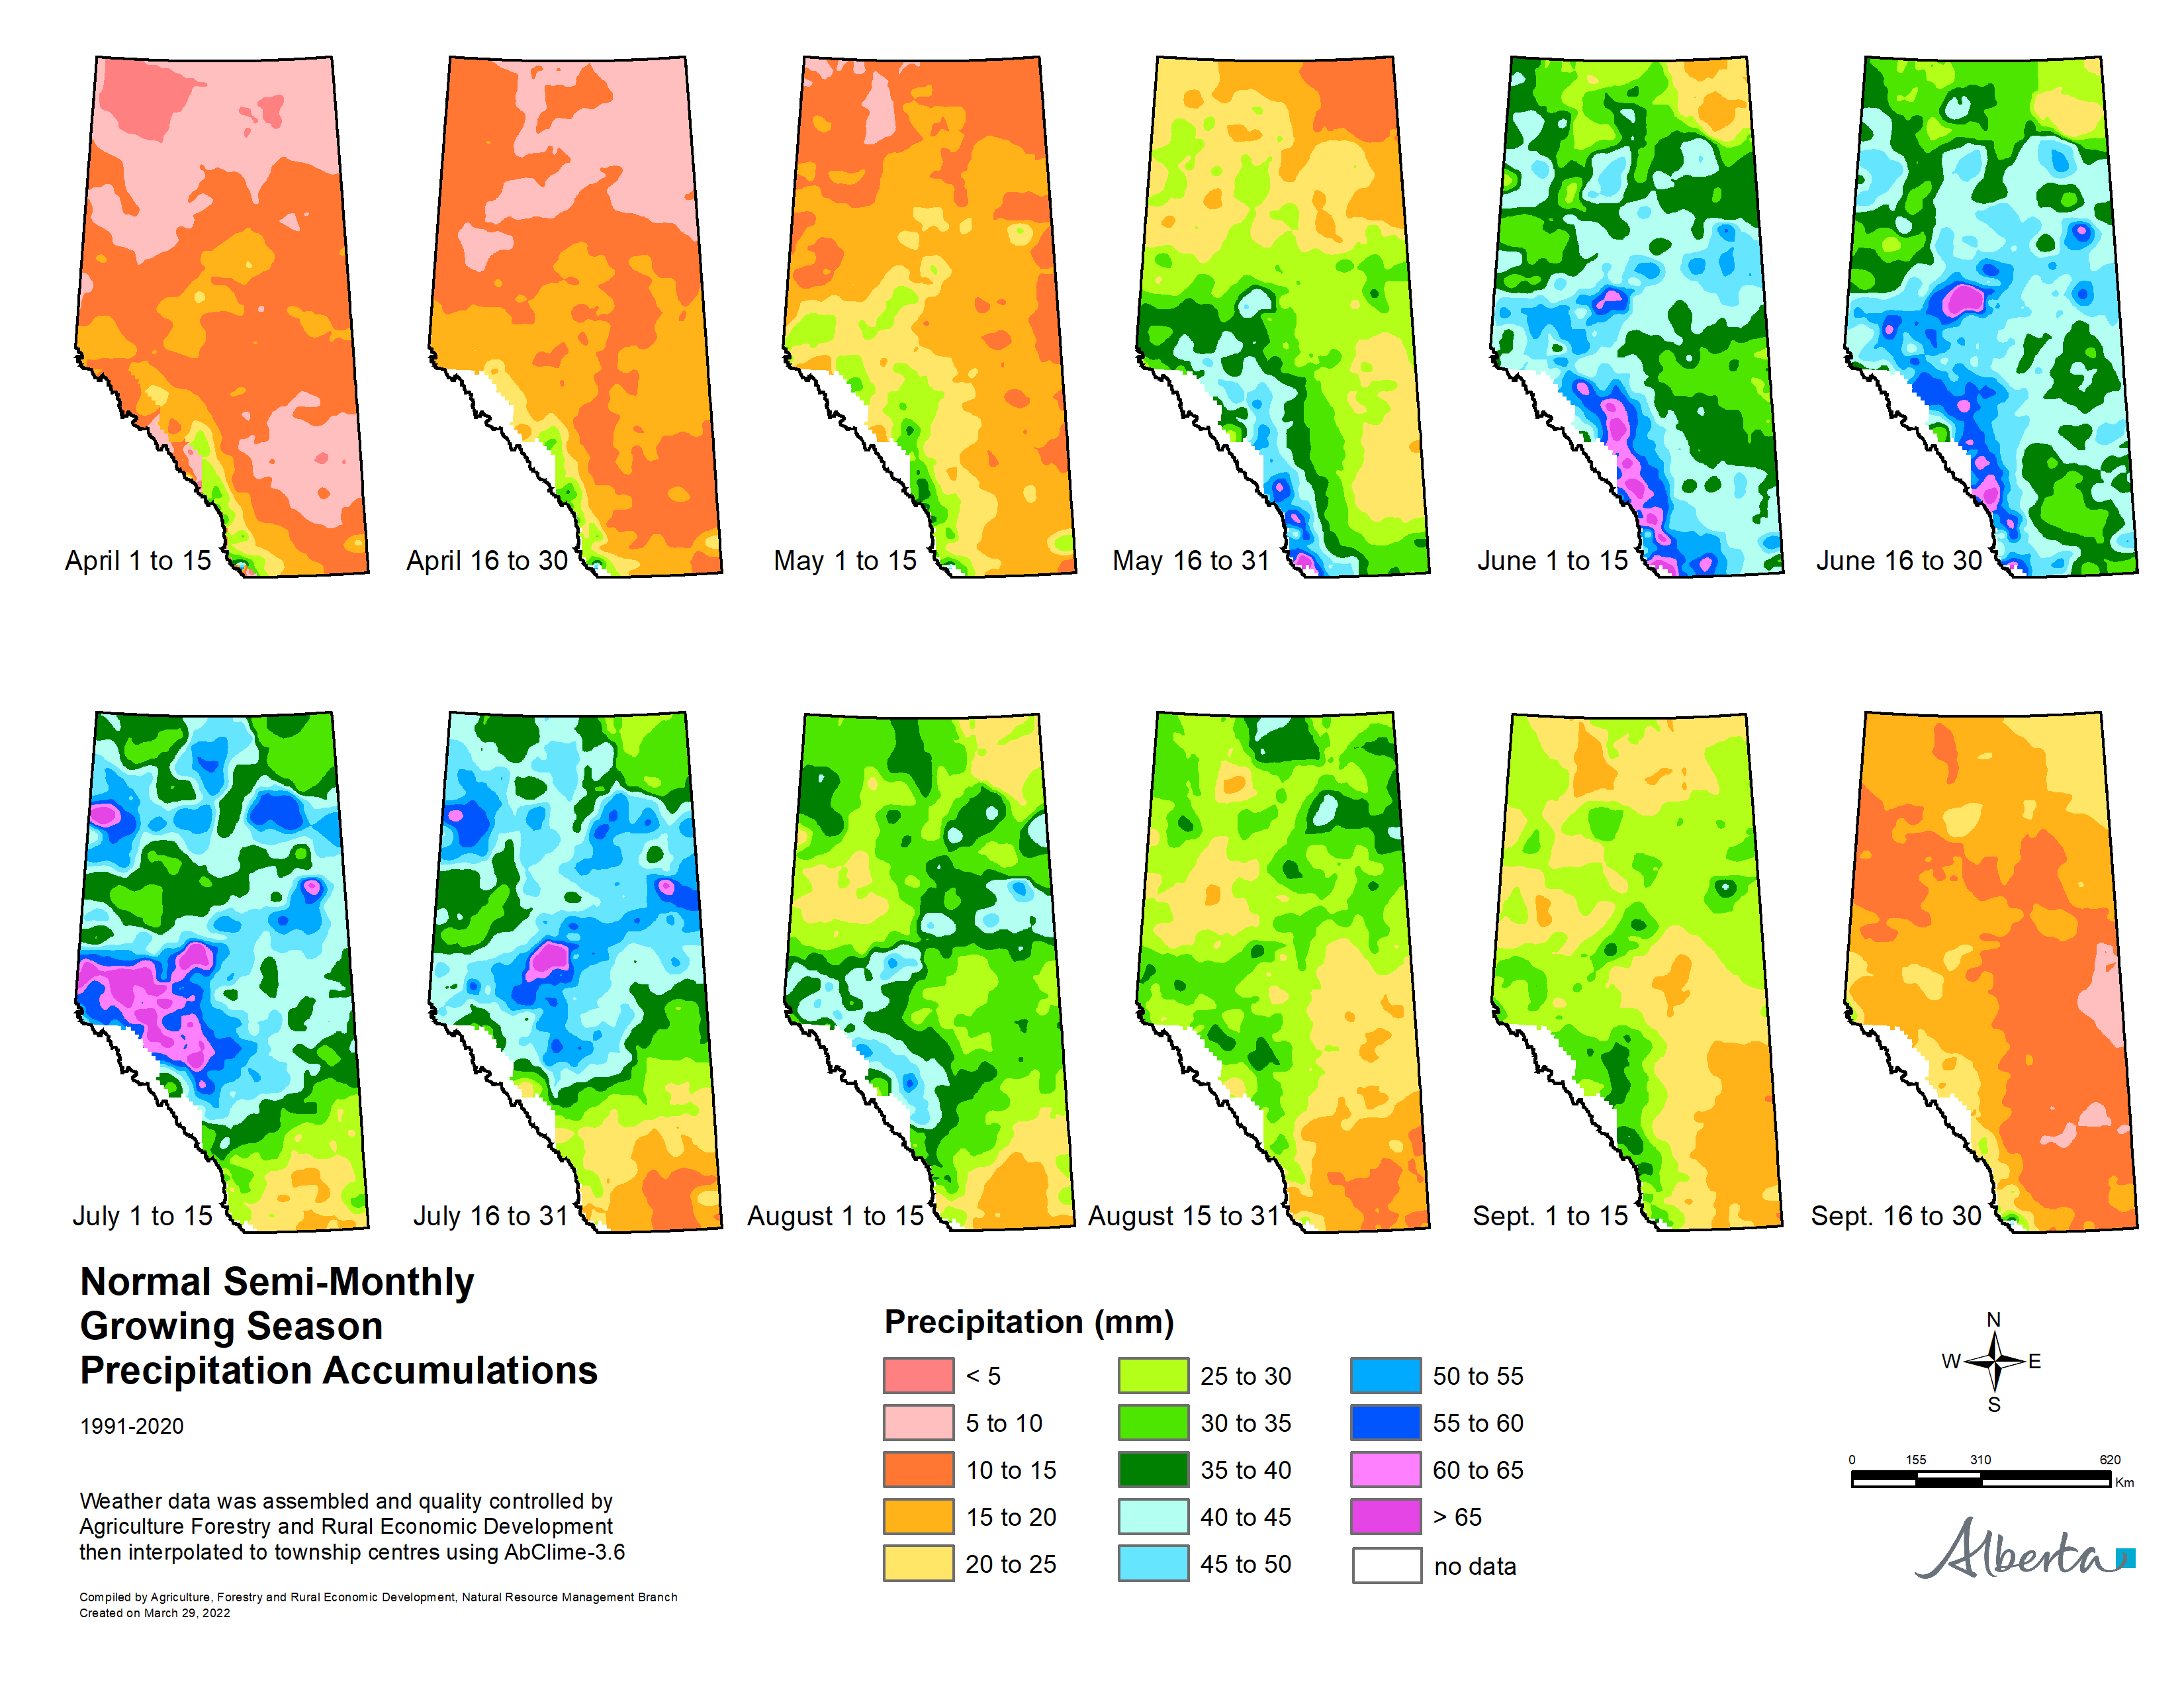
Map 17: Normal Semi-Monthly Growing Season Precipitation Accumulations 1991-2020
Contact Us
Saddle Hills
Junction of Hwy 49 & Secondary Hwy 725
RR1, Spirit River AB
T0H 3G0
T. 780-864-3760
Fax 780-864-3904
Toll-free 1-888-864-3760
frontdesk@saddlehills.ab.ca
Sign up to our Newsletter
Stay up to date on the Saddle Hills activities, events, programs and operations by subscribing to our eNewsletters.