Moisture Updates - August 16, 2023
Synopsis
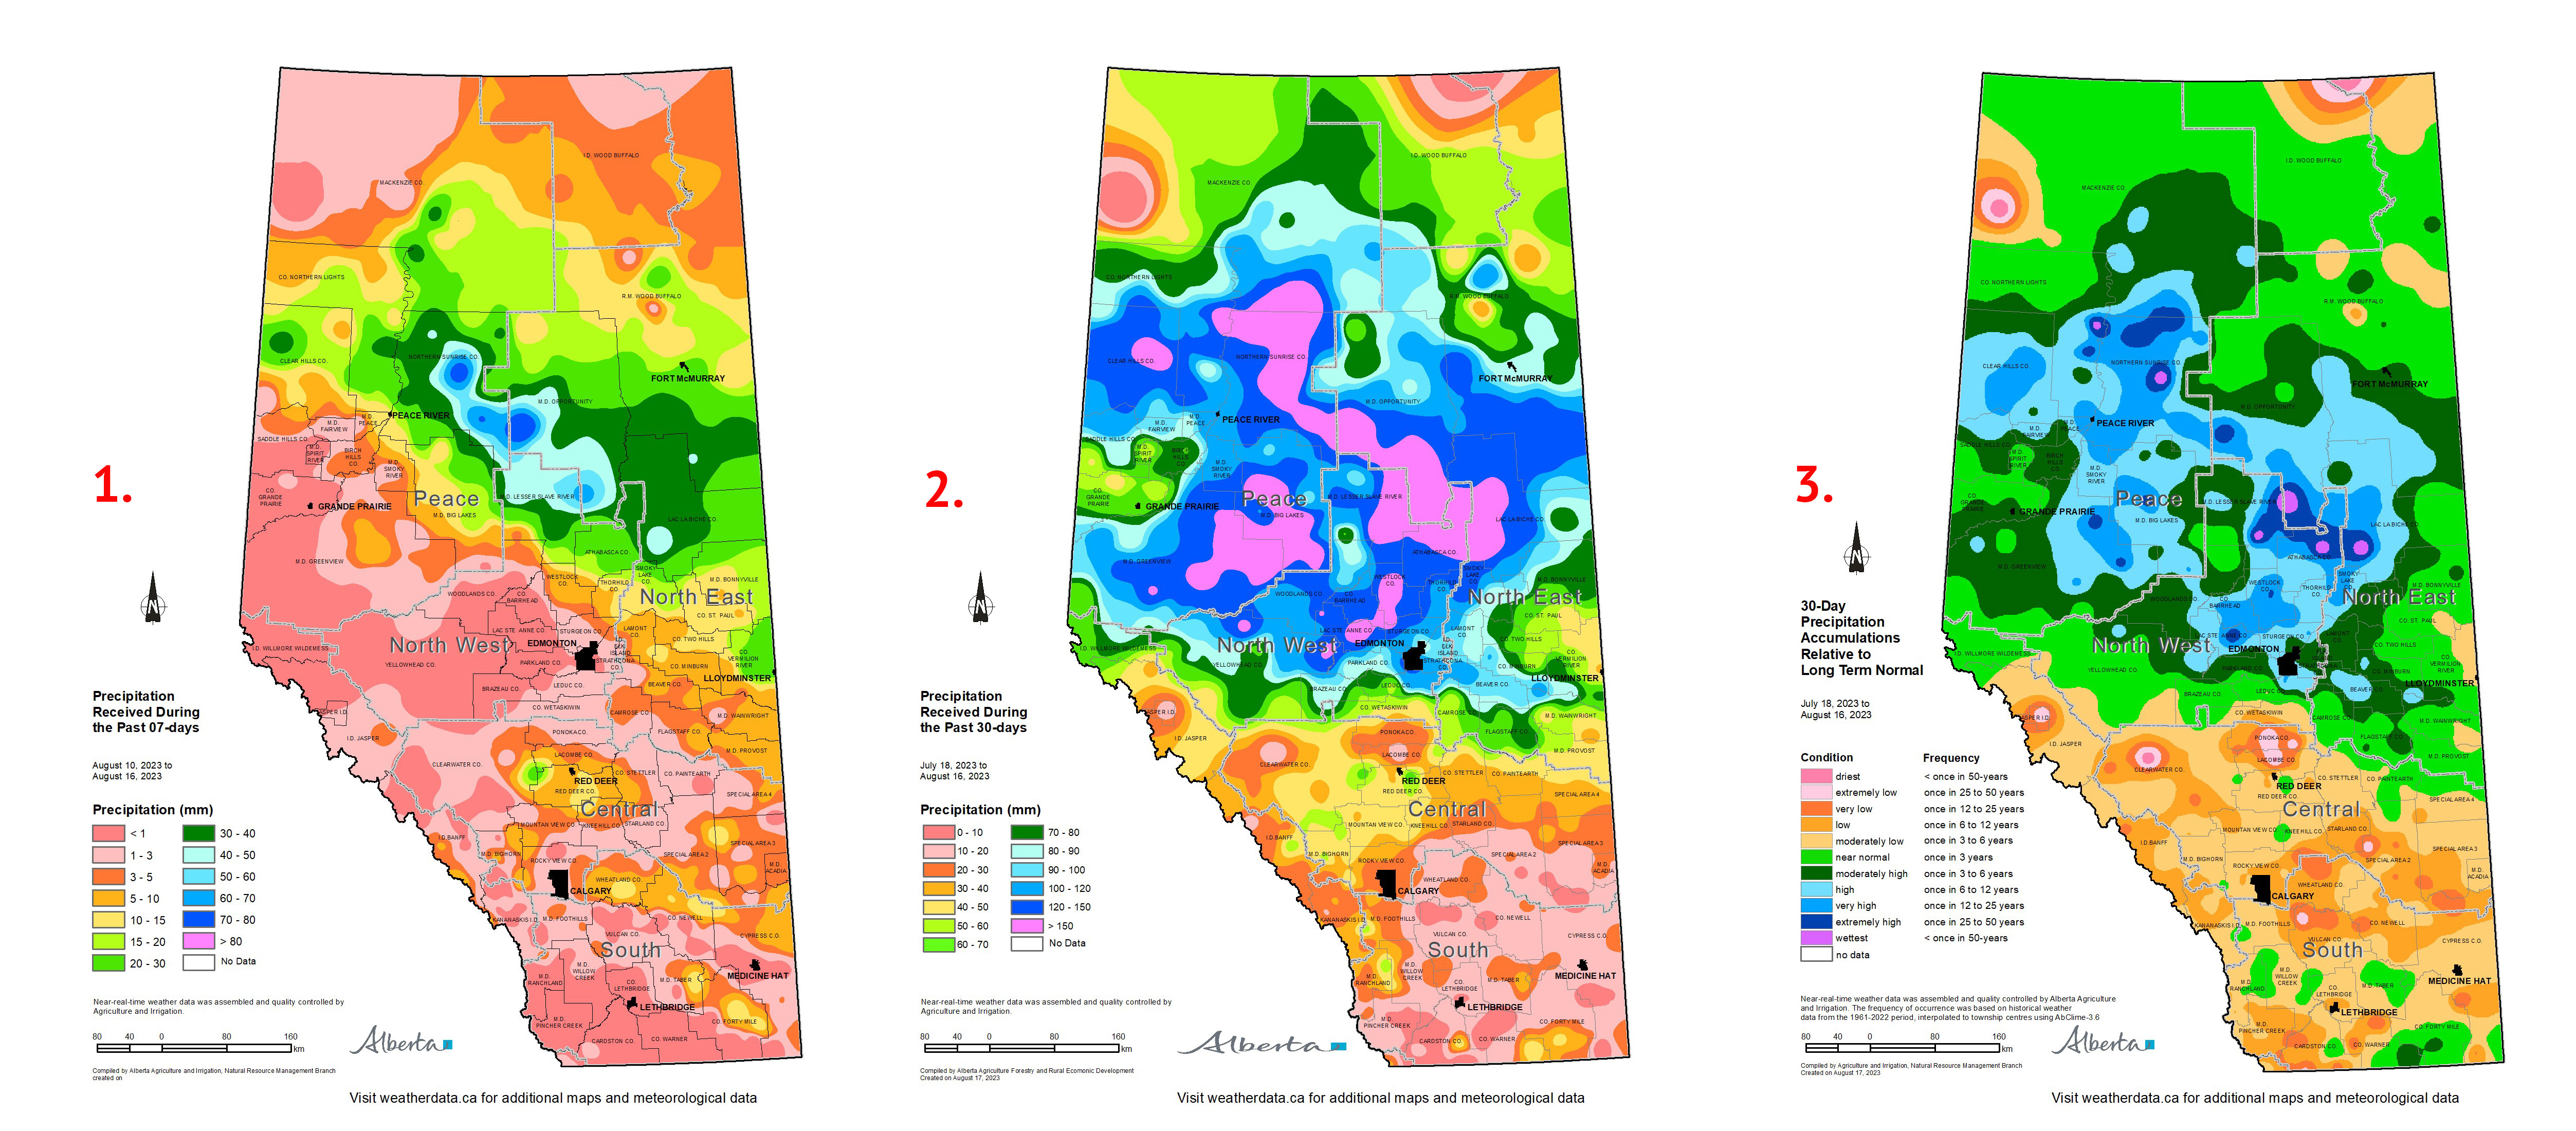
Maps 1, 2 & 3: Rainfall accumulations since the last report (August 9, 2023) have been highly variable across the province, ranging from just over 70 mm across the Forest Protection Areas in the north-central parts of the province, to less than 1 mm across large parts of the North West Region and throughout most of the Southern Region (Map 1). Notably some parts of the Central Region and the North East Region, where it’s been relatively dry, have received a modest but welcome shot of rain ranging from 5 to 10 mm.
The dry week across North West Region was likely welcome as its been offset by significant rains over the past 30-days, ranging from well over 80 mm across a wide area, extending from roughly the Yellowhead Highway up to as far some parts of the Northern Peace Region (Map 2). Lesser amounts fell south of the Yellowhead Highway, extending down as far as through Red Deer, where generally at least 40 mm has fallen. In many of these areas this is still well below average (Map 3). Notably the south has remained quite dry with most lands receiving less than 20 mm over the past 30-days (Map 2), in the face of the warmest months of the summer along with persistent soil moisture deficits.
Growing season precipitation to August 16, 2023
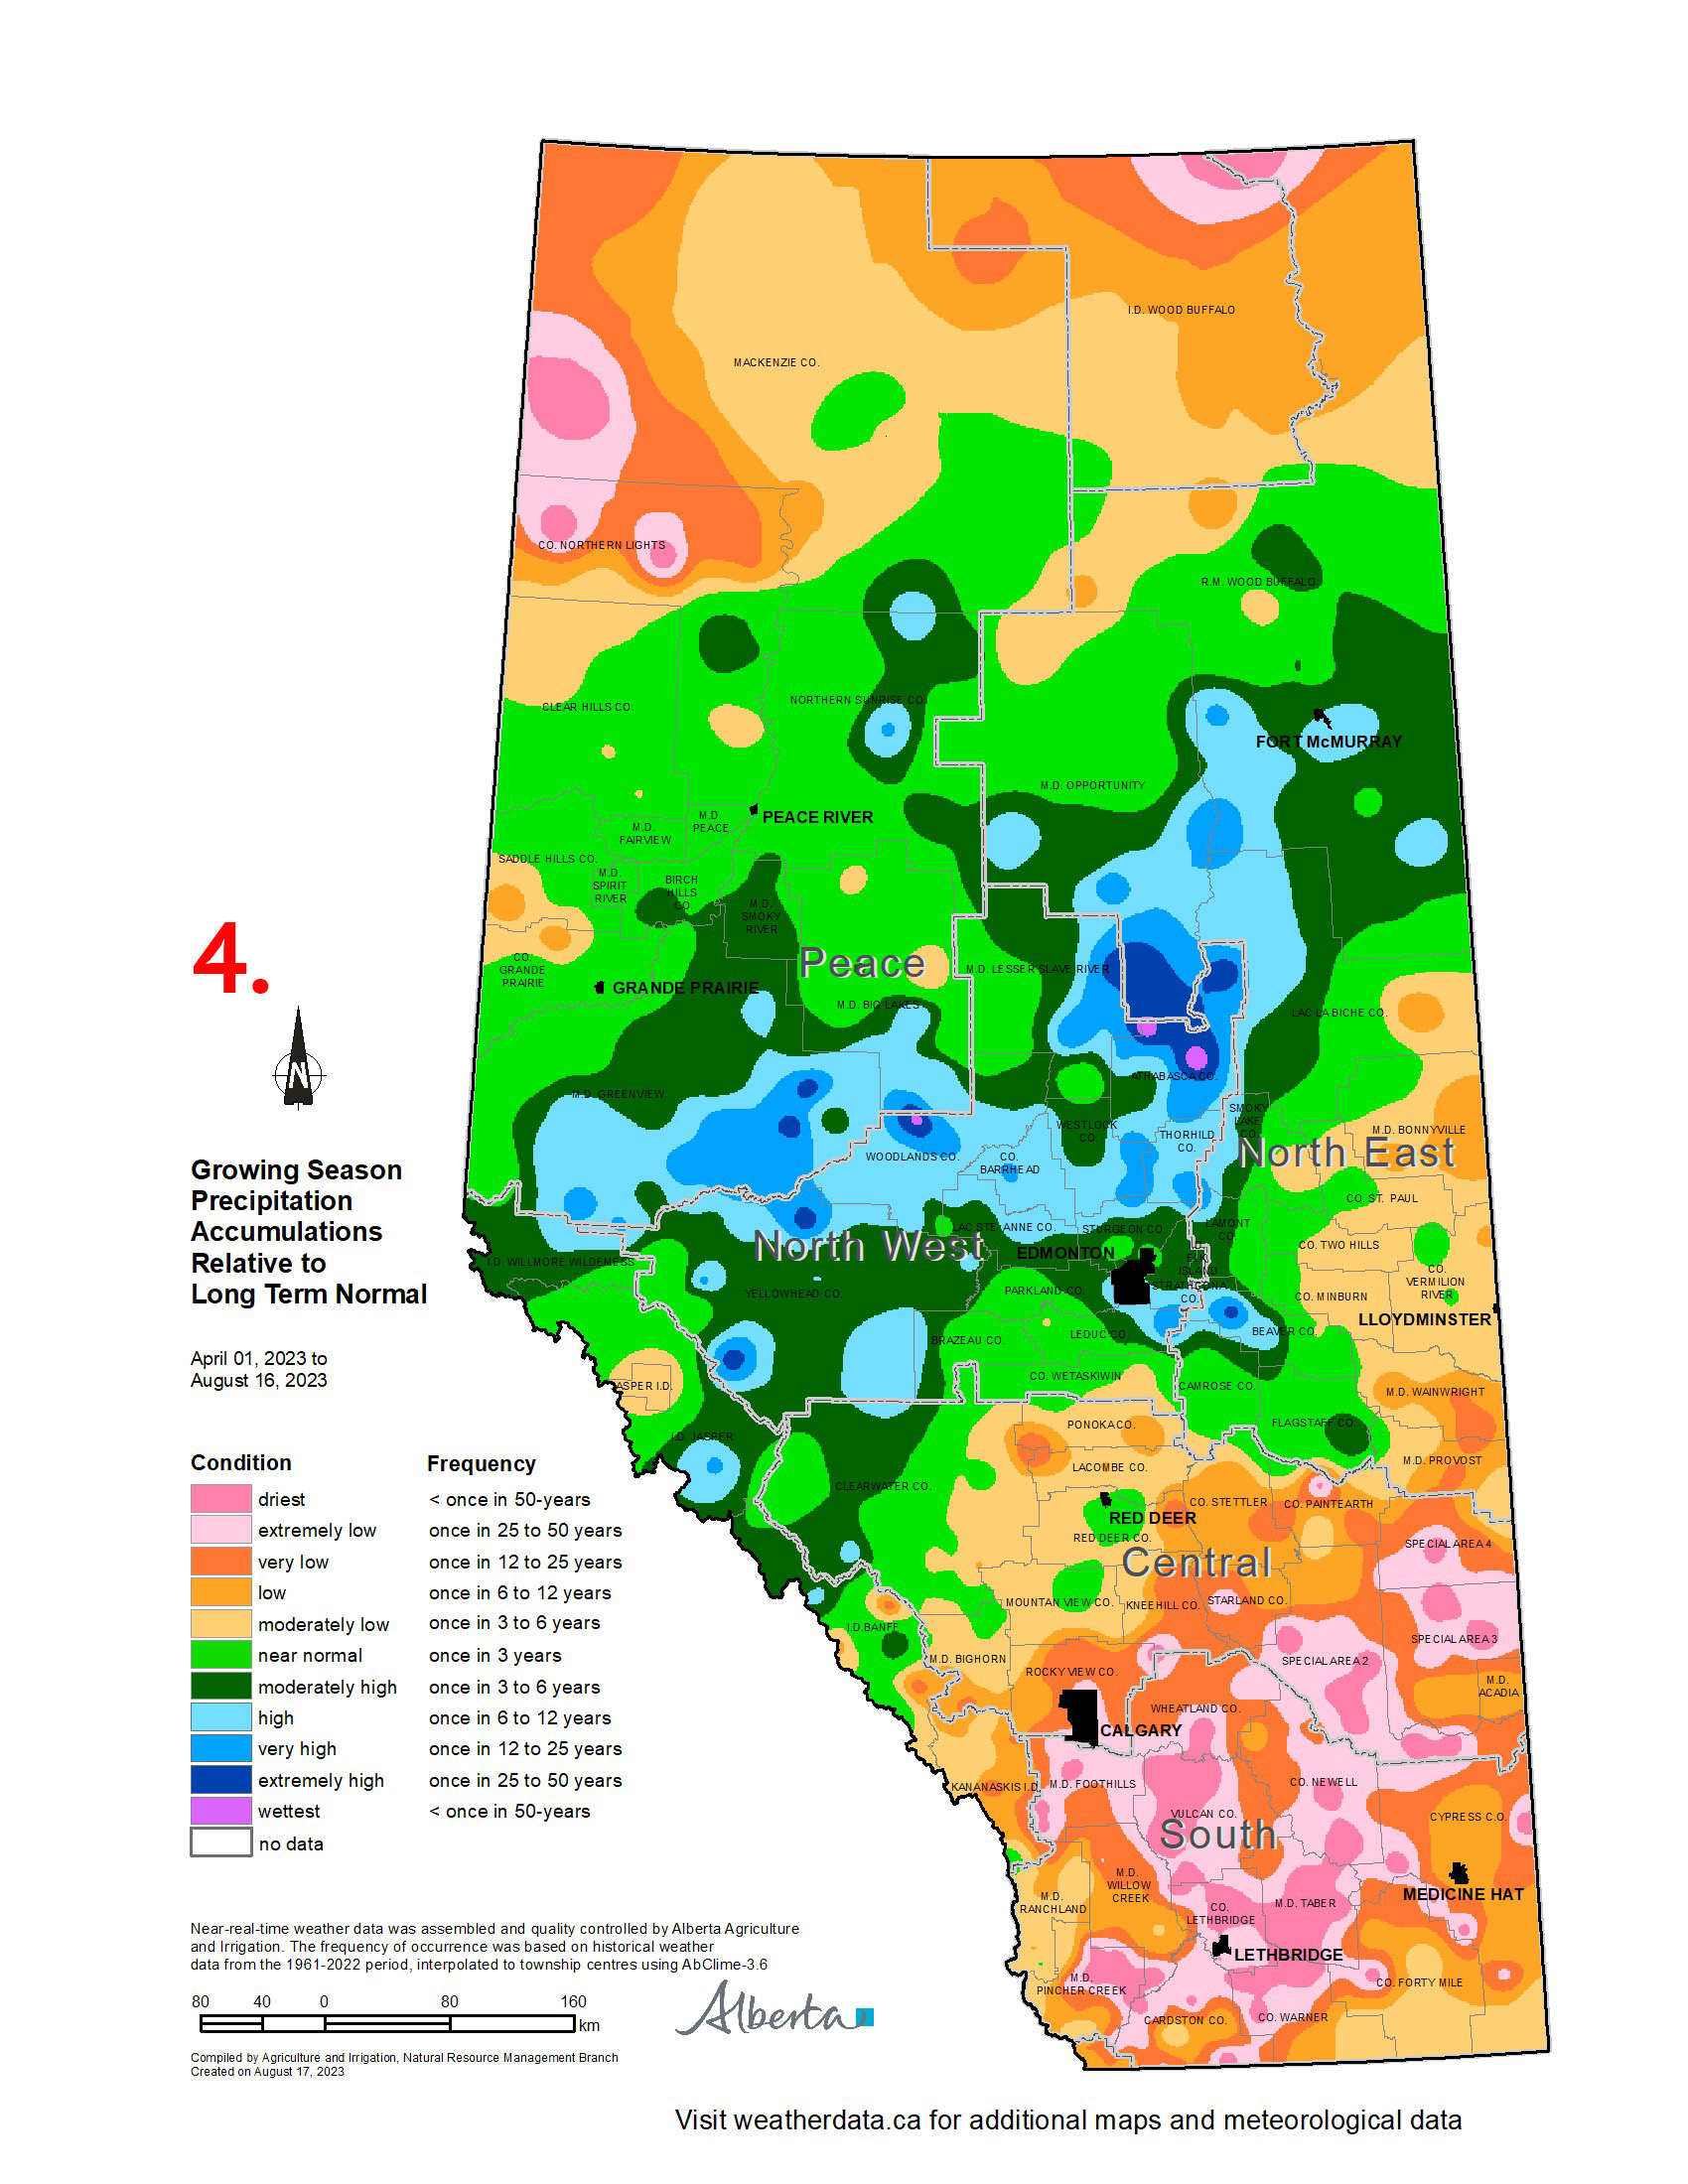
Map 4: Most lands lying south of the east-west line through Red Deer, along with the northern Peace Region and most the east-half of the North East Region, have received below normal precipitation amounts since April 1 (Map 4). Deficits exceeding at least once in 25-year lows are widespread throughout much of the Southern Region and eastern parts of the Central Region, along with at least once in 6-year lows throughout much of the extreme northern Peace Region.
The end of August typically marks the beginning of the soil moisture recharge period than lasts until June the following year. Above average moisture will be needed between now and next year’s planting cycle to bring soil moisture reserves to near normal levels across many areas of the province.
Perspective
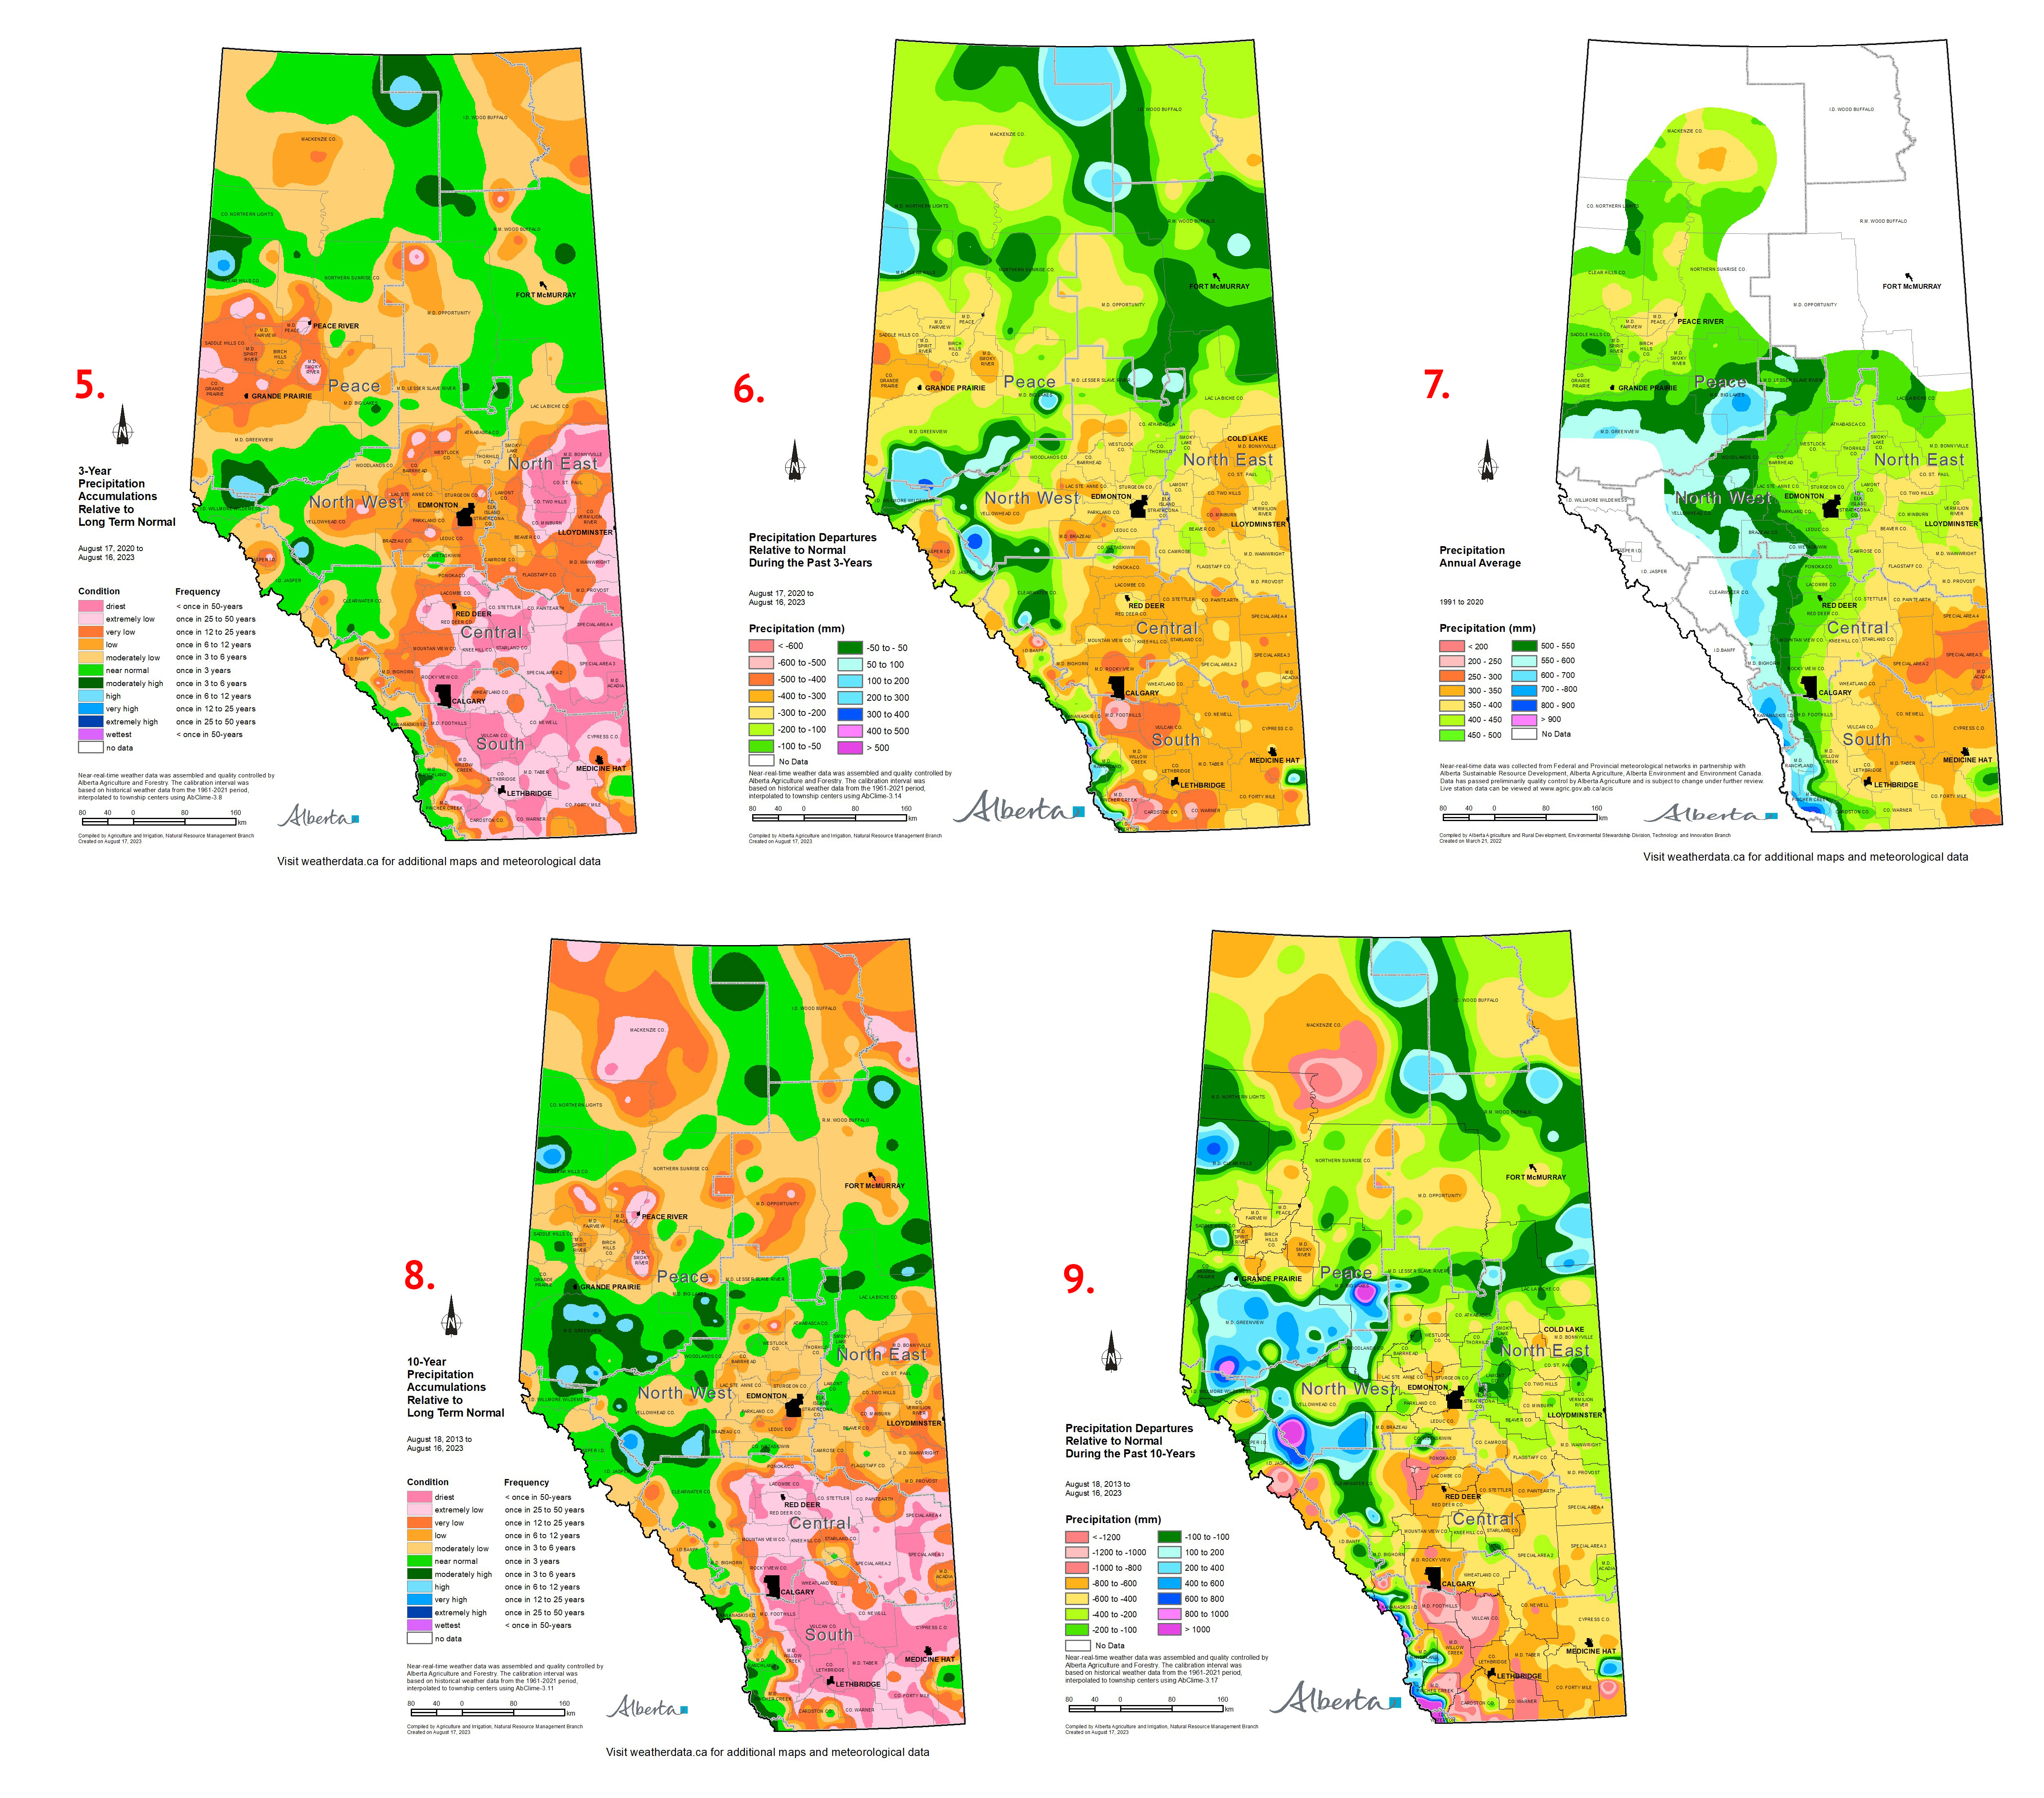
Maps 5, 6, 7, 8 & 9: Much of the southern-half of the province is experiencing extreme long-term moisture deficits, with soil moisture reserves remaining chronically well below normal over the growing season. Such deficits have reduced water levels in rivers, streams, lakes, reservoirs, and dugouts. Much of this is due to successive years of below average precipitation. Looking back over the past 3-years, in general most of the province has been drier than the 1961-2022 average, with large parts of the North East, Central and Southern Regions near 50-year lows (Map 5). Total precipitation deficits over this 3-year period range typically exceed 300-400 mm in these areas (Map 6). This is significant given that the yearly average precipitation accumulations across the Southern Region ranges from about 300 mm across parts of the Special Areas to 400 mm as one moves towards Lethbridge (Map 7). Looking back 10-years the situation is generally similar, with large parts of the Southern Region experience once in 50-year lows and much of the Central Region once in 25 to 50-year lows (Map 8). In general, over the past decade most of the Province has been on the dry side relative to normal, with decadal moisture deficits exceeding 1000 mm across the western portions of the Southern Region and the extreme northern Peace Region (Map 9).
Note that maps 5, 6, 8 and 9 use the 1961 to 2022 period for comparisons. This includes a relatively cool and wet cycle that started in the 1950’s and ended in the late 1990’s. The precipitation accumulations over the past two decades appear to be more reminiscent of the warmer and drier latter part of the 19th century and early part of the 20th century. Thus, it appears that over the past three generations, agricultural production across our province has faced nearly the full range of both wet and dry extremes that are currently contained in our 140-year meteorological record.
Contact Us
Saddle Hills
Junction of Hwy 49 & Secondary Hwy 725
RR1, Spirit River AB
T0H 3G0
T. 780-864-3760
Fax 780-864-3904
Toll-free 1-888-864-3760
frontdesk@saddlehills.ab.ca
Sign up to our Newsletter
Stay up to date on the Saddle Hills activities, events, programs and operations by subscribing to our eNewsletters.