Moisture Update - March 3, 2024
Since January 30, 2024, temperatures have generally remained above normal across most of the province (Map 1). Fortunately for most lands from Grande Prairie down to the US Border, precipitation was at least near normal (Map 2). During February, above average moisture was received across most of the foothill areas from Edson to the US Border, including the plains in and around Lethbridge, along with parts of the Special Areas. It should be noted that February is typically the driest month of the year, so this was not enough to erase long running moisture deficits but it does mark a promising shift in recent moisture patterns. In sharp contrast, most of the forested lands from the Swan Hills to Alberta's northern border remained dry.
Over the 30 days to February 28, 2024, total precipitation accumulations (Map 3) ranged from well over 100 mm at some of the mountain stations west of Lethbridge, with the greatest amounts measured at the Spoinkop Creek Station at 170 mm, located approximately 25 km northwest of the Town of Waterton Park. During the 60 days since the beginning of the year, the Spoinkop Creek Station has recorded 252 mm of precipitation, followed closely by Gardiner Headwaters at 234 mm, Akimina 2 at 195.5 mm, and South Racehorse Creek at 197 mm. To put this into perspective, snow pillow readings are currently below normal throughout the majority of the mountain areas and at the height of the season in late-April, the snow pillow sites at Gardiner Creek and South Racehorse Creek average roughly 600 and 400 mm respectively, of water equivalency in the snowpacks. This shows that the moisture gap does seem to be narrowing in some areas, a trend which hopefully continues into the spring and summer months. Further east, much of the land along the foothills received over 40 mm of moisture, with upwards of 20 mm in the Lethbridge area, along with some of the land in each of the four agricultural regions (Map 3). In contrast, the northern parts of the province received in the range of 1 to 10 mm with snowpacks still critically low, a serious concern heading into wildfire season.

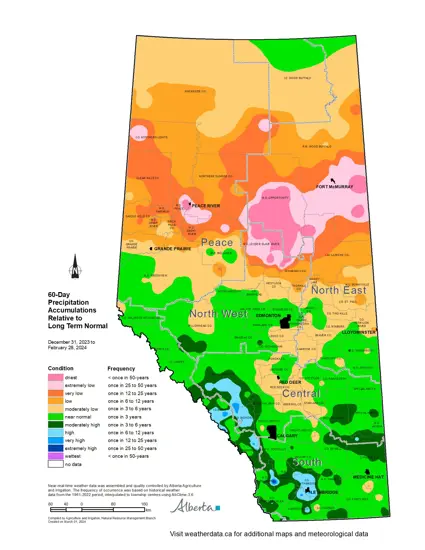
60-Day Precipitation Accumulations to February 28, 2024
In about 80% of the land lying between Yellowhead Highway and the US Border, the trend in near normal precipitation accumulations extends back to the beginning of January (Map 4). North of the Highway a long-running dry trend has continued, with large areas in the north-central part of the province trending at near once in 50-year lows.
Due to above average temperatures and below normal precipitation over the winter months, most of the province's agricultural areas have snow packs that are well below normal, with the exception of large parts of the Southern Region (Map 5). However, the Southern Region is often snow-free at this time of year, so a 'near-normal' designation is simply a derivation and snow currently on the ground in these areas is still relatively light and even absent in some places. Overall, few of the province's agricultural lands have more than 20 mm of water contained in the snowpacks (Map 6), with the greatest amounts estimated to be in the range of 30-40 mm in relatively small parts of each of the agricultural regions. In an average year, most of the land north of Olds has at least 60 mm of moisture in the snowpacks, with over 100 mm across the Peace Region (Map 7). However, winter is not over yet. As we head into spring and the season's strong El Niño event wanes, there is still ample opportunity to receive significant moisture events ahead of the spring melt.
Typically, Alberta's dry season runs from November to the end of the March. As the wet season still lies ahead it's impossible to predict with certainty how much moisture the province will receive. To illustrate the average moisture patterns typically received over the coming months, a running 5-day average precipitation accumulation chart is useful. For example, on April 5 the 5-day average would be taken from April 1 to April 5 during the 1991-2020 period. Each day in the year is plotted similarly, yielding detailed seasonal moisture patterns that, may not surprisingly, show a wet spell over the May long weekend.
Graph 1: For Southern Alberta, Lethbridge's 5-day rolling average chart shows the wet season typically begins in early April and peaks during June 6 to June 20, with a sharp decline in moisture beginning around July 6.
Graph 2: For East-Central Alberta, Youngstown's rolling average chart shows a drier trend than Lethbridge, with the wet season beginning around April 20 and peaking between June 5 to July 20, with more moisture extending late into August.
Graph 3: For North-Central Alberta, Vegreville's wet season begins around April 14 and has a broad peak from June 1 to August 15.
Graph 4: For the Peace Region, Peace River's wet season doesn't typically begin until early May, peaking between June 5 to July 12, with several wet episodes persisting into August and early September.
These charts can be generated for most of Alberta’s 500 meteorological stations here. They are incredibly useful for understanding when moisture is due and are helpful in reminding us that the wet season still lies ahead and there is a good statistical chance of seeing reasonable moisture levels for the cropping season.
Alberta is in need of a long overdue wet cycle to put an end to the widespread drought that has lasted for many months to several years in some areas. Forecasts over the following days promise further moisture, particularly in southern parts of the province.

Total Precipitation from February 28 to March 3, 2024
Many of the mountain stations saw more than 40 mm of additional precipitation. The foothills between Hinton and the US Border saw 10-15 mm, while the eastern side of the province from the Special Areas to Wood Buffalo recorded 5-10 mm. Reasonable accumulations of 5-10 mm were experienced in the western portions of the Central and North West Regions. Levels were relatively low across parts of the Southern Region and through Athabasca County, at under 2 mm.

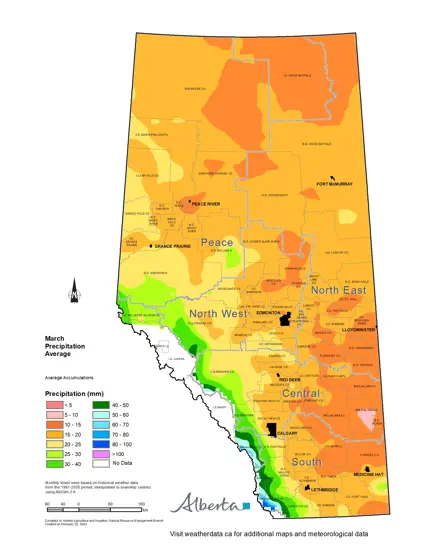
March Perspective
For the entire month of March, average accumulations (Map 2) range from 20-25 mm in the foothills down to less than 10 mm in parts of the Special Areas.
Contact Us
Saddle Hills
Junction of Hwy 49 & Secondary Hwy 725
RR1, Spirit River AB
T0H 3G0
T. 780-864-3760
Fax 780-864-3904
Toll-free 1-888-864-3760
frontdesk@saddlehills.ab.ca
Sign up to our Newsletter
Stay up to date on the Saddle Hills activities, events, programs and operations by subscribing to our eNewsletters.


