Moisture Update - March 24, 2024
Synopsis
Maps 1 & 2: Since the beginning of March, further moisture has fallen across the southern-half of the province, with much of this occurring within the past week. So far, most of southern Alberta and western portions of the Central Region have received over 20 mm of moisture, grading to upwards of 30 mm in some areas (Map 1).
Since January 1, 2024, seven high elevation stations in southwestern Alberta have recorded over 250 mm of precipitation. The highest amounts were recorded at the Spionkop Creek Station at 340 mm, followed by Gardiner Head Waters at 333 mm. For these stations, 30-year averages for this time frame are estimated to be 250 mm and 190 mm, respectively. This is a good start to replenishing water supplies in these critical headwater areas of the South Saskatchewan River Basin and winter here is not yet over.
Additionally, dry forested areas in the Fort McMurray area have seen modest but much needed moisture, with 15 to 20 mm falling across large parts of the RM of Wood Buffalo (Map 1). In contrast, many parts of the North West, North East, and Peace Regions have remained relatively dry, with most lands receiving between 5 to 10 mm. Within these regions several stations have recorded less than 5 mm.
Over all precipitation accumulations for the period March 1 - 24, 2024, have been near normal or above for approximately half of the province, while other areas are still in the grip of drying trend (Map 2).
90-Day Precipitation Accumulations
Maps 3, 4 & 5: For the area extending south from Red Deer, the near-normal trend has persisted for at least 90-days, with some areas within this trending to above normal (Map 3). However, for most land north of this, drier than normal weather has persisted and has been quite intense across the north-central parts of the province. Large areas of at least once in 25-year lows exist through parts of the Peace Region, along with a large pocket of at least once in 50-year lows evident across the forested areas extending east of Slave Lake. Since the beginning of January, several stations in this region have reported less than 20 mm (Map 4), which is less than 30% of normal precipitation for this time frame (Map 5).
180-Day Precipitation Accumulations
Maps 6 & 7: Looking back over the past 180-days, most of southern Alberta and the western portions of the Central Region have been experiencing at least near-normal moisture, and some areas are approaching once in 6 to 12 year highs (Map 6). In sharp contrast, large parts of the north-half of the province are facing once in 50-year lows, a drying trend that has persisted since September. It should be noted that some of these lands referenced across the north were quite wet in June, July, and August (Map 7). However, the extreme northern parts of the province largely missed out on much of this ample summer moisture and precipitation deficits are intensifying.
365-Day Precipitation Accumulations

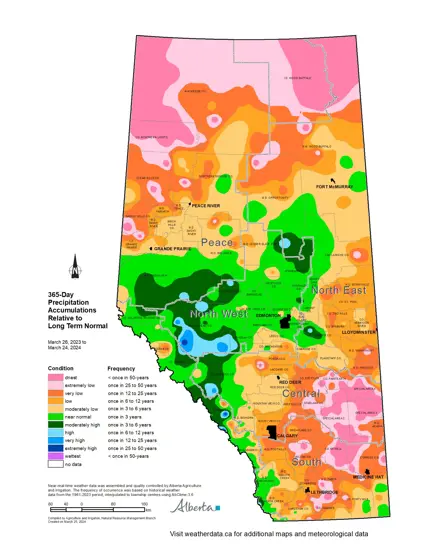
Map 8: While 90-day trends are pointing to a near normal moisture regime across at least the southern third of the province (Map 3), serious moisture deficits still remain in this area (Map 8). Across the southern parts of the province approximately 20-25% of the total average yearly accumulations fall during the November to March period. Therefore, recent 90 and 180-day trends are not enough to overcome the deep moisture deficits (at least once in 50-year lows) that have been developing over the longer term. At the very least the recent moisture is a promising trend that we all hope will continue.
Elsewhere, year-over-year deficits are present across most of Alberta's growing areas and throughout most of the northern forests, with large areas in the extreme northwest and northeast approaching once in 50-year lows (Map 7). This is of great concern to the Province's firefighters, as evidenced by an early official start to the wildfire season.
Perspective
The National Oceanic and Atmospheric Administration (NOAA) is observing that the current El Niño event, sometimes responsible for warm/dry winters, appears to be weakening, with ENSO neutral conditions to potentially develop by April - June. By June - August, there is a 55% chance that we may see a shift to a La Niña, sometimes responsible for cool and wet conditions. It’s very difficult to predict with certainty what this impact will be on moisture and temperature regimes across Alberta. However, many do surmise that it is likely to lead to instability in the Jet Stream that may reduce the likelihood of a long hot and dry spell. As we break out of March and head into the wetter months of the year ahead, near to above normal moisture will be required to sustain crop growth. A long stretch of above normal moisture and/or an extreme wet spell will be needed to help replenish dwindling surface water supplies.
Contact Us
Saddle Hills
Junction of Hwy 49 & Secondary Hwy 725
RR1, Spirit River AB
T0H 3G0
T. 780-864-3760
Fax 780-864-3904
Toll-free 1-888-864-3760
frontdesk@saddlehills.ab.ca
Sign up to our Newsletter
Stay up to date on the Saddle Hills activities, events, programs and operations by subscribing to our eNewsletters.


