Moisture Update - February 26, 2025
Synopsis
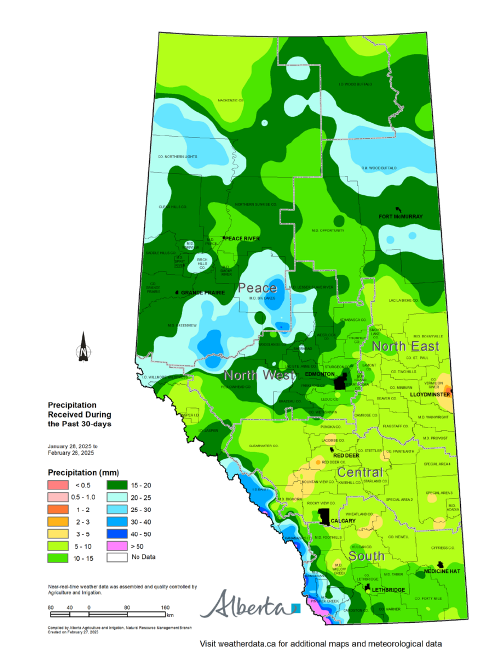
Maps 1, 2 & 3: Since January 15, 2025, the agricultural areas of the province have generally received anywhere from 5 to 25 mm of precipitation (Map 1). Accumulations have been greatest through the North East and Peace Regions, with some areas receiving more than 25 mm of moisture. The northeast, central, and the north half of the South Region, received 5 to 10 mm of moisture.
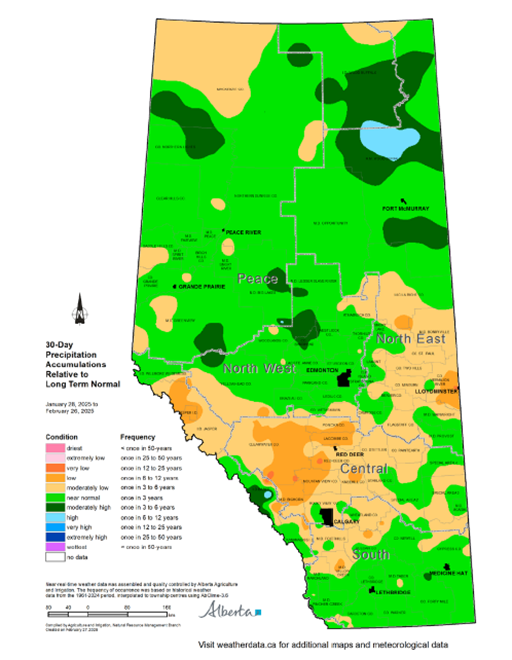
Although it should be noted, late January and February are usually the driest times of the year in Alberta (Map 2). Relative to normal, the 30-day precipitation accumulations (Map 3) show drier than normal trends occurring in a triangle, running along the foothills from north of Claresholm, to north of Rocky Mountain House, and east to Bonnyville, affecting a large portion of the Central and North West Regions. Across the dry areas, accumulations relative to normal range from once in 3 to 6-year lows to once in 6 to 12-year lows. The area north of Drayton Valley, up to the County of Northern Lights, and east to the Saskatchewan border, along with southern Alberta, are reporting 30-day precipitation accumulations of near normal.
Below normal level of precipitation seen last month through the west half of the Central Region, has continued this month. The below normal accumulations reported through the North West and Peace Regions, with the exception of the very north Peace, have helped the region to improve to near normal conditions.
Winter Precipitation Trends
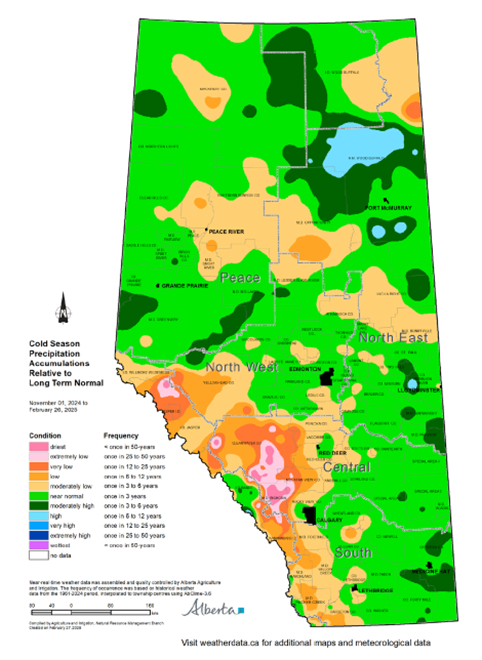
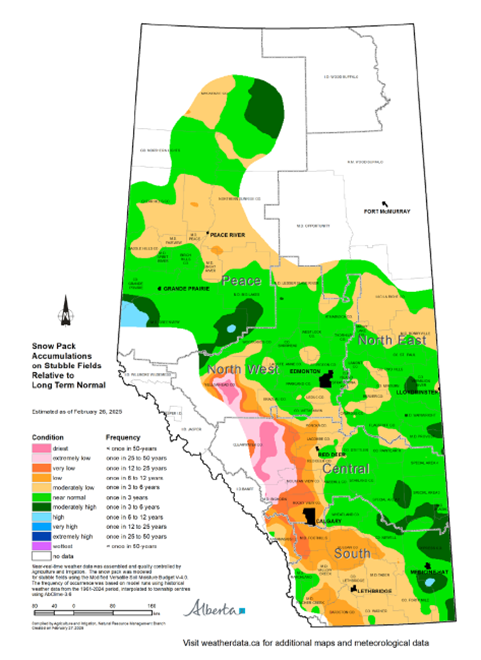
Maps 4 & 5: Winter (cold season) precipitation accumulation (Map 4) and snowpacks (Map 5) to date, are near normal across much of the east half of the province, north and east of Edmonton, and north into the Peace Region.
Western portions of the North West, Central, and South Regions, and the area including the mountains, continue to report moderately low (once in 3 to 6-year lows), low (once in 6 to 12-year lows), and very low (once in 12 to 25-year lows) accumulations, relative to normal. Some mountain and foothill areas report extremely low accumulations relative to normal (once in 25 to 50-year lows). The areas reporting lower than normal conditions has pushed further east since the last report.
365-Day Precipitation Trends
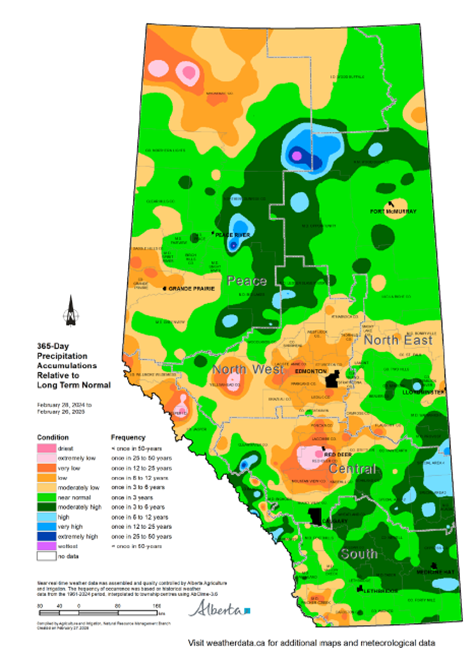
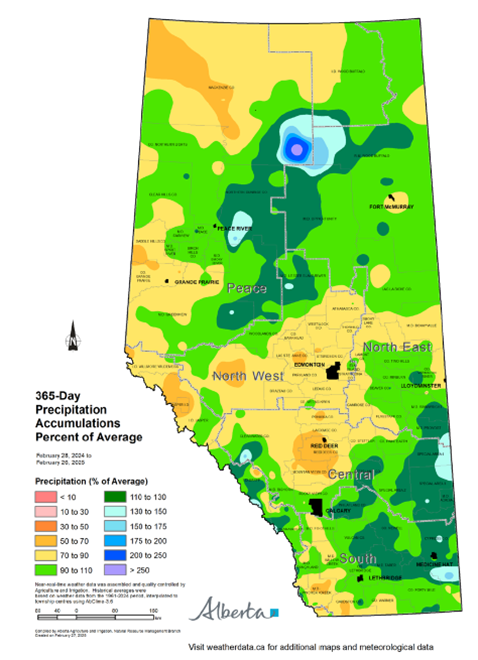
Maps 6 & 7: Looking back over the past 365 days, precipitation accumulations (Map 6) continue to remain below normal across a large area, from Mountain View County, north to Yellowhead County, extending east to the Saskatchewan border. Similar below normal conditions are also being recorded through much of the Peace Region. Once in 25-year lows continue to persist in areas in, and around, Red Deer, with once in 6 to 12-year lows extending east to the mountains, north of Edmonton, and west of Grande Prairie, as well as the northern Peace Region as far as the border with the Northwest Territories. This area is reporting, relative to average, year-over-year precipitation accumulations 70 to 90% of normal (average) with some areas only receiving 50 to 70% of annual average precipitation (Map 7).
Conversely, land south and east of a line between Calgary and Lloydminster, extending to the US and Saskatchewan borders respectively, are reporting moderately higher than normal precipitation accumulations. Here, some areas are reporting accumulations of 110 to 130% of normal (average), along with some relatively small pockets reporting accumulations of 130 to 150% of normal, which is positive news for those farming in these areas.

Perspective
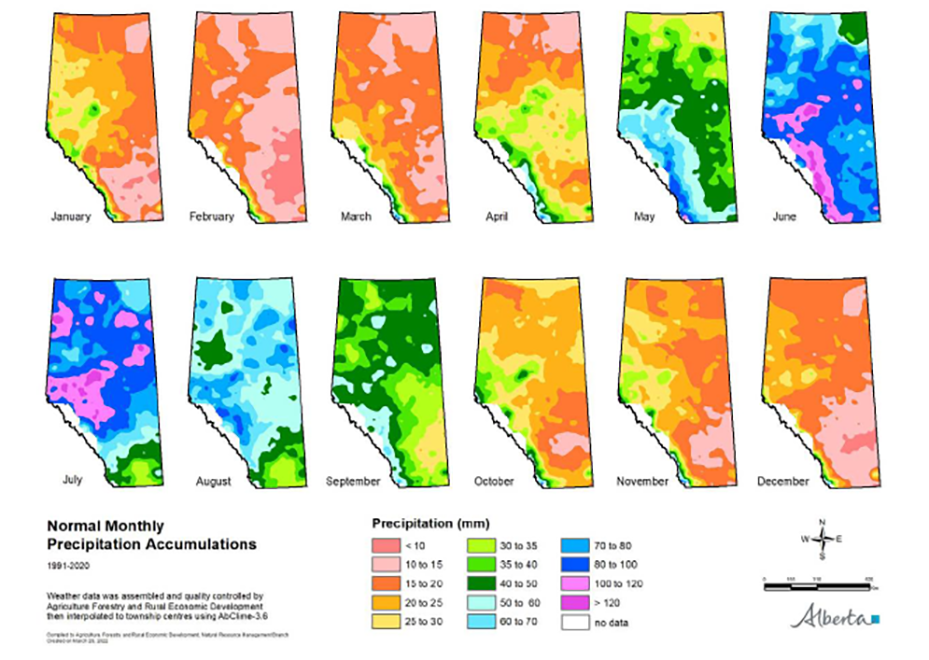
Map 8: It is important to emphasize that this last 30-day period, on average, is the driest time of the year. The normal precipitation for the agricultural area that runs east of the highway 2 corridor from Bonnyville, south to the Saskatchewan border, averages 10 to 15 mm over this time frame. As you move north and east of this region, normal precipitation levels increase to 15 to 20 mm, and continue to increase to 20 to 25 mm across the Peace Region. Being the relative dry season, even above average moisture at this time of year is typically not enough to make a significant impact on “year-to-date” moisture deficits, nor would it usually be sufficient to create excess moisture conditions. For example, across the Central Region 15% to 17.5% of the average annual moisture falls during the November to March time period (Map 8). However, across the Peace Region, winter moisture tends to be very important for the annual water cycle with at least 25% of the annual moisture falling during this time frame.
Current precipitation trends across some parts of the province, such as the below normal snowpacks in the foothills and throughout much of the Peace Region, are trending on the dry side, and these areas have been experiencing drier conditions for several months now.
The areas of the province reporting higher than normal snowpacks, have declined compared to the last report. An increase in below normal snowpack conditions at this time is not abnormal in itself as February is the driest month of the year, as mentioned earlier. For agriculture, May, June, and July remain the most important months for receiving precipitation. The 2025 cropping season is only a few months away. We are beginning to move into what has traditionally been Alberta’s wetter period, meaning there is ample time to receive adequate moisture.
Contact Us
Saddle Hills
Junction of Hwy 49 & Secondary Hwy 725
RR1, Spirit River AB
T0H 3G0
T. 780-864-3760
Fax 780-864-3904
Toll-free 1-888-864-3760
frontdesk@saddlehills.ab.ca
Sign up to our Newsletter
Stay up to date on the Saddle Hills activities, events, programs and operations by subscribing to our eNewsletters.